Download
1 / 9
90 likes | 226 Views
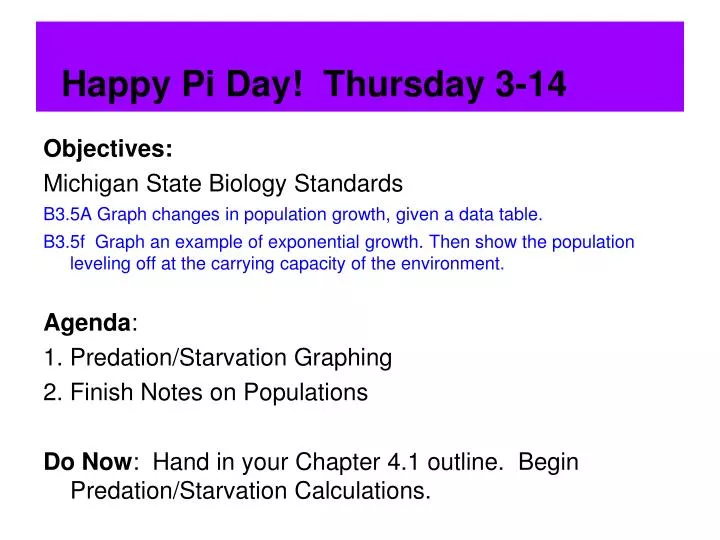
Happy Pi Day! Thursday 3-14. Objectives: Michigan State Biology Standards B3.5A Graph changes in population growth, given a data table. B3.5f Graph an example of exponential growth. Then show the population leveling off at the carrying capacity of the environment. Agenda :

E N D
Happy Pi Day! Thursday 3-14 Objectives: Michigan State Biology Standards B3.5A Graph changes in population growth, given a data table. B3.5f Graph an example of exponential growth. Then show the population leveling off at the carrying capacity of the environment. Agenda: 1. Predation/Starvation Graphing 2. Finish Notes on Populations Do Now: Hand in your Chapter 4.1 outline. Begin Predation/Starvation Calculations.
Carrying Capacity Carrying Capacity: the number of organisms of one species that an environment can supportindefinitely. Predict:Circle the Best Answer What happens when a population reaches its carrying capacity? a) there are more births than deaths b) there are more deaths than births c) there are almost equal rates of birth and death
Carrying Capacity 1. When a population is developing in an environment with resources there are more births than deathsand the population increases until the carrying capacity is reached or passed. 2. When a population overshoots the carrying capacity, then limiting factors may come into effect. Deaths begin to exceed births and the population falls below carrying capacity. 3. Thus the number of organisms in a population is sometimes more than the environment can handle, and sometimes less.
Why Don't Populations Reach Carrying Capacity and Remain Stable? Population biologists study the factor that determines population growth - an organism's reproductive pattern, also called it's life-history pattern. A variety of population growth patterns are possible in nature. Two extremes are demonstrated by mosquitoes and elephants. Mosquitoes exhibit a rapid life-history pattern. They reproduce very rapidly and produce many offspring in a short period of time. Elephants exhibit a slow life-history pattern. They have a slow rate of reproduction and produce relatively few offspring over their lifetime.
Rapid Life-History Patterns Rapid Life History Patterns are common among organisms from changeable or unpredictable environments. Rapid life-history organisms have a small body size, mature rapidly, reproduce early, and have a short life span. Populations of rapid life history organisms increase rapidly, then decline when environmental conditions suddenly change and become unsuitable for life. The small population that survives will reproduce exponentially when conditions are again favorable. Examples: mosquitoes, houseflies...
In Your Own Words: Describe how this population of mosquitoes in 2008 is changing over time: What is it like in May? In July? In August? September? October?
Slow Life-History Patterns Slow life-history patterns are common among large species that live in stable environments. Slow life-history organisms reproduce and mature slowly, and are long-lived. They maintain population sizes at or near carrying capacity Examples: humans, elephants, bears, whales, trees
In Your Own Words Describe how this population of elephants is changing over time: