Download
1 / 8
80 likes | 294 Views
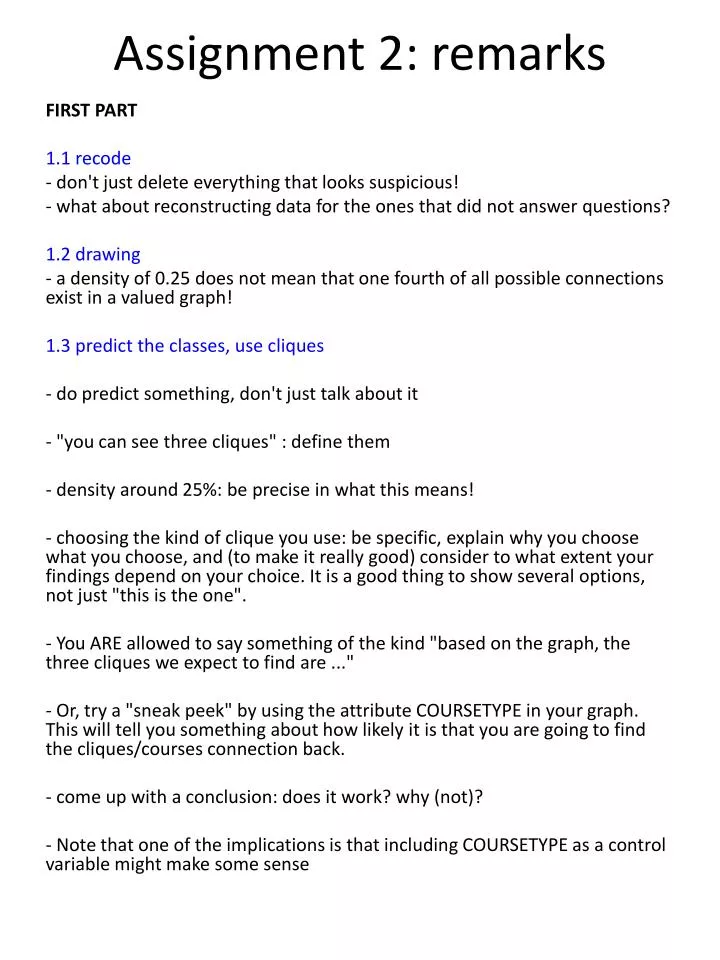
Assignment 2: remarks. FIRST PART 1.1 recode - don't just delete everything that looks suspicious ! - what about reconstructing data for the ones that did not answer questions ? 1.2 drawing

E N D
Assignment 2: remarks FIRST PART 1.1 recode - don'tjustdeleteeverythingthatlookssuspicious! - whataboutreconstructing data for the onesthatdid not answerquestions? 1.2 drawing - a density of 0.25 does not meanthat one fourth of allpossibleconnectionsexist in a valuedgraph! 1.3 predict the classes, usecliques - do predictsomething, don'tjust talk aboutit - "youcanseethreecliques" : definethem - densityaround 25%: be precise in whatthismeans! - choosing the kind of cliqueyouuse: be specific, explainwhyyouchoosewhatyouchoose, and (to makeitreallygood) consider to whatextentyourfindingsdepend on your choice. It is a goodthing to show severaloptions, not just "thisis the one". - You ARE allowed to saysomething of the kind "based on the graph, the threecliques we expect to findare ..." - Or, try a "sneakpeek" by using the attribute COURSETYPE in yourgraph. Thiswilltellyousomethingabouthowlikelyitisthatyouaregoing to find the cliques/coursesconnectionback. - comeup with a conclusion: doesitwork? why (not)? - Notethat one of the implicationsisthatincluding COURSETYPE as a controlvariablemightmakesomesense
(continued) 2.1 check data // 2.2 aboutyou / position / resource data - refer to the literature about the scales that I suggested - don't present everything as if it is all clear-cut: it (usually) isn't, certainly not here - cliques, clans, factions, k-scores, something else?? - the aboutyou works quite well (either 3 or 4 dimensions / if you stretch it then you could argue 6 even). - the position and resource data don't work so well, especially the resource data. However, your results can be dependent on which items you include. Also, it helps to have a look at the literature (you could have found some pointers as to which professions typically go together, for instance). - Also: note that the position data and resource data are binary items which is actually not allowed or at least often not a good idea in factor analysis - Don't just say "doesn't work". Give it a fair try. - in the resource items, several had no variance and needed to be excluded - what to do (later) when you find that the scale that should measure opinion leadership is a different one from the one that you find (as is the case here) - Even if the scale values do not work, you might argue that for instance simply adding the number of contacts is a measurement of something. And that worked reasonably well for both the position generator and the resource generator - When rotating, start by using oblique rotation
“We obviously see 1/3/4 cliques here”
Screeplot of the [aboutyou] variables … How many dimensions are there? 3? 4? 6? Consider the theoretical answer Check which interprets easiest
A2 - SECOND PART - introduction: start with a problem or interesting finding, not with data - don't make your main question too broad ("How can social network characteristics be connected to personal characteristics?") - if you symmetrize: explain how and why! Mention at least something about the symmetry issue. Does it occur often that A rates B differently than vice versa? - Don't use data to derive your hypotheses. You are going to test your hypotheses on your data. You cannot use it as a source for hypotheses and then test these hypotheses on the same data. - Use parallels, but wisely. You cannot make the argument stick that weak ties are better for access to money based solely on a reference to Granovetter. - If you consider structural holes having an effect on something, you have to explain why you use which kind of measurement (effective size, efficiency, constraint, hierarchy) - When people are considered to be an opinion leader the network size is expected to be larger than an average person. Do you really mean that? - the theory parts should not be just copies of the slides - Do not make Hypotheses that are each other’s mirror image. In this case, you just do not have a hypothesis. - it is hard to find significant results: the group is simply too small. Still: some effort in trying to do the data justice is in order. Also: even though the data might show you no significant effects, everything leading up to your analyses should not suffer from that. - assumptions of the analyses: check them (BTW don't just say you did) - how about outliers? Especially in small data sets, the chances of an outlier are serious. - in a real paper, you don't show SPSS output, but prepare a separate regression table (now not considered in grading) - Note: you can be unlucky, if you for instance choose the completely wrong setup for a hypothesis, or if you use a wrong kind of analysis
Please make an appointment (with me) if you want detailed feedback(let me know fast so that I can schedule them for next week on Wednesday)Grading: comparison of originality of arguments, correctness of used methods and answer, relevant references to the literature, level of detail and care-intensity.
EXAM (0zm05 and 0em15) • All the material that is online for your course (slides, papers, etc), except for everything labeled “extra” (so 0em15 has more material) • Paper and pencil • First multiple choice (ask around) • Several open questions, possibly also an essay question • (obviously the exams are not completely overlapping)
Next week: no lectureNevertheless, if you have any questions, ask!