Download
1 / 60
600 likes | 698 Views
Status and Trends of Tidal Wetlands In New York’s Marine District. Fred Mushacke , Dave Fallon, Evan Picard- NYS Conservation Dept., 205 Belle Mead Rd. E. Setauket, NY e-mail: fmushac@gw.dec.state.ny.us Ph. (631) 444-0465. Wetland Values: Marine food production

E N D
Status and Trends of Tidal Wetlands In New York’s Marine District Fred Mushacke , Dave Fallon, Evan Picard- NYS Conservation Dept., 205 Belle Mead Rd. E. Setauket, NY e-mail: fmushac@gw.dec.state.ny.us Ph. (631) 444-0465
Wetland Values: Marine food production production up to 4 tons /acre/year
Tidal Wetlands Program History • 1973 Tidal Wetlands Act (Article 25)- Protect and Preserve Tidal Wetlands and • their values 1974Tidal Wetland Inventory- Identify and Classify all Tidal Wetlands in the Marine District. 1977 Tidal Wetlands Land Use Regulations (Part 661) Become Effective- Regulate all types of activities within 150 ft (NYC), 300ft Nassau/Suffolk and Westchester from the Tidal Wetlands boundary 1989 Tidal Wetlands Re-Inventory– Evaluate effectiveness of tidal wetlands regulatory program and conduct a trends analysis.
1974 1999-2004 A c r e s West Pond A c r e s 1974 1999-2002
Areas of Quantitative and Qualitative Assessment in the Peconic Bay Estuary Oyster Ponds Cedar Beach Creek Goose Creek Dickerson Creek Southold West Creek Corey Creek Hubbard Creek Southampton Haywater Cove 1974 2002-2005 A c r e s 1974 Riverhead
West Pond New Rochelle
West Pond 1966 Dosoris Pond LIS
West Pond 1974 IR Area of vegetated intertidal marsh 21.8 acres. 2005 IR Area of vegetated intertidal marsh 8.6 acres.
West Pond 1974 - 21.8 acres; 2005 - 8.6acres. 13.2 acres lost, 0.42 acres lost/year
West Pond July 6, 2006 Comparing the changes from 1974 to 2005 reveals a loss of 60.6% or 0.42 acres/year of vegetated marsh, Spartina alterniflora.
West Pond New Rochelle
Flax Pond 1974 IR 2004 TC
1974 - 2004 Flax Pond Digital (GIS) Comparison 14 acres loss = 22% loss / 30 years = 0.46 acres/yr Smith’s pond 1974 - 73 acres 2004– 57 acres
S O U T H O L D Bayview Cedar Beach West Creek Corey Creek Little Peconic Bay
Cedar Beach 1974 Tidal Wetland inventory CIR 2002 NYS true color SAV aerial
Cedar Beach, Southold 1974 Tidal Wetlands- 19.72 acres 2002 Tidal Wetlands 11.16 acres 8.56 acres lost over 28 years Rate 0.3 acres/year 43% loss
Findings Large acre wetland complexes, qualitatively studied, show no apparent loss of vegetated marsh Spartina alterniflora. Wetland islands appear to sustain greater loss than land based marshes. With the exception of Jamaica bay losses (44acres/year), Losses throughout the island, in the marshes studied, are occurring at ½ -3/4 an acre/year To date no “smoking gun” cause or impact has been found. Each wetland complex seems to have a unique loss fingerprint, some are easily speculated due to past impacts others remain puzzling. Based on current trends, of the 15 areas studied, approx. 1395 acres (8%) of S. alterniflora marshes have been lost since 1974. That’s 5580 tons of organic material/year unavailable to the marine ecosystem.
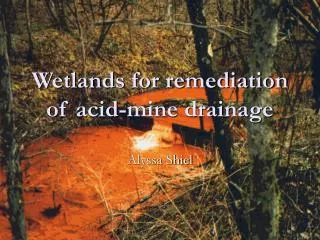
Sediment Budget Disruption Ponding Wind and Wave Erosion Ice scraping, gouging, tearing and expansion Sea Level Rise Maintenance of man-made structures Potential Factors Causing Loss
Next Steps/Strategies Obtain funding to complete LI Trends Analysis Assess areas for TW loss Determine reasons for losses Develop management plans Become partners with towns, villages and local groups Begin remediation process DEC web site: www.dec.state.ny.us/website/dfwmr/marine/twloss.html
Issues to Consider • What is the extent of tidal wetlands loss? • What are the causes? • What effect will the loss of primary productivity have on endangered marine species? • How will they be resolved?
Acknowledgements Dave Fallon Evan Picard New York State Police Suffolk County Planning National Park Service Soil Conservation Service
East side of Broad Channel, Jamaica Bay ice rafting of Spartina marsh tussock
1974 IR 1999 TC
1974 - 1999 Stony Brook Harbor Digital (GIS) Comparison 40.62 acres loss = 57.5% loss / 25 years = 1.62 acres/yr 1974 - 70.6 acres 1999 - 30.0 acres
1974 - 2004 Flax Pond Digital (GIS) Comparison 14 acres loss = 22% loss / 30 years = 0.46 acres/yr 1974 - 73 acres 1999 – 58 acres
Tidal Wetlands Loss In New York’s Marine District Tidal Wetlands; Here Today, Fred Mushacke , Dave Fallon, Evan Picard- NYS Conservation Dept., 205 Belle Mead Rd. E. Setauket, NY e-mail: fmushac@gw.dec.state.ny.us Ph. (631) 444-0465
Tidal Wetlands Program History • Tidal Wetlands Act- Protect and Preserve Tidal Wetlands and their values. 1974Tidal Wetland Inventory- Identify and Classify all Tidal Wetlands in the Marine District. 1977 Tidal Wetlands Regulations Become Effective- Regulate all types of activities within 150 ft (NYC), 300ft Nassau/Suffolk of Tidal Wetlands boundary .
S O U T H O L D Bayview Cedar Beach Corey Creek Little Peconic Bay
Location Of Jamaica Bay CT. Westchester N.J. Nassau Queens Brooklyn Jamaica Bay
Findings Large acre wetland complexes, qualitatively studied, show no apparent loss of vegetated marsh Spartina alterniflora. Wetland islands appear to sustain greater loss than land based marshes. With the exception of Jamaica bay losses (44acres/year), Losses throughout the island, in the marshes studied, are occurring at ½ -3/4 an acre/year To date no “smoking gun” cause or impact has been found. Each wetland complex seems to have a unique loss fingerprint, some are easily speculated due to past impacts others remain puzzling. Based on the complexes assessed approx. 1395 acres of S. alterniflora marsh have been lost.
Mt. Sinai Harbor 1974 IR 1999 TC
1974 - 1999 MT. Sinai Harbor Digital (GIS) Comparison 46.67 acres loss = 48.96% loss / 25 years = 1.86 acres/yr 1974 - 95.3 acres 1999 - 48.7 acres
1974 IR 1994 IR
1974 - 1994 Manor Haven Digital (GIS) Comparison 1974 - 8.91 acres; 1994 - 3.42 acres 5.49 acres loss = 61% loss / 20 years = 0.25 acres/yr