Download
1 / 7
230 likes | 740 Views
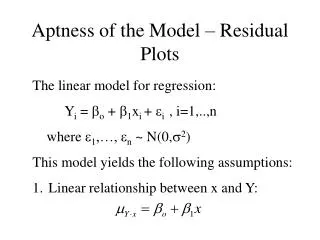
Residual Plots. 15.3. Residuals. The difference between actual data points and ones predicted by the regression line (line of best fit). If the residuals are small, the model is good. Predicted Value. Residual. Observed Value. Finding Residuals. From the graph.

E N D
Residual Plots 15.3
Residuals • The difference between actual data points and ones predicted by the regression line (line of best fit). • If the residuals are small, the model is good. Predicted Value Residual Observed Value
Finding Residuals From the graph From the equation (predicted outcomes)
Residual Plots • Graph the x-value and the residual value to see how good our regression line models the data. • Look for 3 things for the model to be appropriate • Equal number of points above the x-axis and below • No obvious patterns (linear, exponential) • Small values for the residuals (y-axis)
What do these Residual Plots tell us? • All of these show residual plots for bad models. What is the biggest problem with each of the graphs? The top two graphs show residuals that are too large (too high on the y-axis) The bottom two graphs show patterns which mean we shouldn’t use a linear model
Residual Plot • Does the Residual Plot indicate that our model (regression line) is a good predictor for this data? Explain. • YES • equal number of points above & below the x-axis • no pattern • all residuals ≤