Download
1 / 31
310 likes | 368 Views
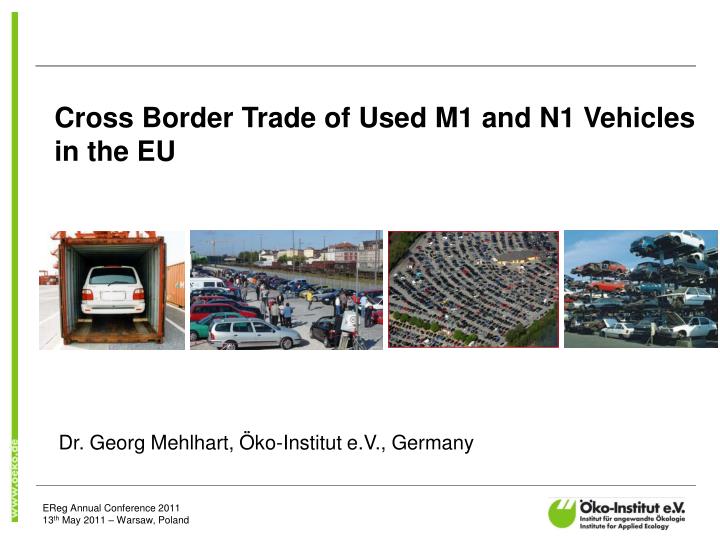
C ross Border Trade of Used M1 and N1 Vehicles in the EU. Dr. Georg Mehlhart, Öko-Institut e.V., Germany.

E N D
Cross Border Trade of Used M1 and N1 Vehicles in the EU Dr. Georg Mehlhart, Öko-Institut e.V., Germany
is a leading European research and consultancy institute working for a sustainable future. Founded in 1977, the institute develops principles and strategies for realising the vision of sustainable development globally, nationally and locally. key clients are ministries and federal agencies, industrial enterprises and the European Union. employs more than 130 staff, including more than 85 researchers at three locations in Germany – Freiburg, Darmstadt and Berlin. They complete approximately 300 projects each year, tackling both national and international issues. Home page (German): http://www.oeko.de Home page (English): http://www.oeko.de/home/dok/546.php
Content Cross Border Trade of Used M1 and N1 Vehicles in the EU • Background and Aim of the Study • International Sources • National Sources • Commercial Sources • Concluding remarks • Reference
Background and Aim of the Study The study has been commissioned by the EC with the aim to support • better forecast of the national fleet compositionand • better modeling / forecast of emissions caused (or resources used) by M1 and N1 vehicles. (DG Climate Action) for instance for models like TREMOVE and • better understanding of the whereabouts of ELVs and the surprising low numbers of ELVs/CoDs reported (DG.ENV)
Sources • International Sources as Eurostat or ACEA • Extra EU-Trade • Intra EU Trade • National Sources • Commercial Sources as for instance POLK
Extra EU Trade: Flow chart for 2008 The data from the Eurostat Foreign Trade Statistics (FTS) for extra-EU 27 trade is identified as a reliable source. An analysis of the data showed that the majority of the “unknown whereabouts” should be considered as scrapped or hoarded within EU 27 and that only a minority of “unknown whereabouts” is exported as used vehicles or exported as ELV used for spare parts. Details of exported cars (fuel, motor size, value, destination) might be extracted from FTS
Intra EU Trade: Foreign Trade Statistics (FTS) • Intra-EU 27 trade for used vehicles are imports and exports between the EU Member States. • FTS for intra-EU 27 trade is unsuitable for describing the cross-border trade of used vehicles, because it is reported by economic operators beyond high thresholds only. • Thus the data does not cover the entire market and displays numbers far below reality.
Intra EU Trade: Foreign Trade Statistics (FTS) Exemption thresholds in € exempted from reporting for intra-EU trade (Eurostat, 2009)
National Sources • To get access to national stakeholders and sources a comprehensive online survey has been conducted in Summer 2010.
National Sources • Contributions from 14 MS • Only a minority provided detailed figures (break down by origin / destination, age, mileage, fuel & size of engine, value). • Germany1) was identified as the main exporter so that the German figures on destination and abroad re-registration provide the order of magnitude of the import for several other countries.
National Sources:Break down by age and fuel and motor size for Poland • Czech Republic, Hungary, Poland, Slovakia and Finland, (all net importing countries) provided more detailed data on the used vehicle characteristics for several consecutive years. • Poland was identified as the largest importer by far in absolute numbers with more than 60 % of its imports coming from Germany.
National Sources: Balance for national car parks Balance for two consecutive years and vehicle ages: • Scrappage refers to effective scrappage only, i.e. ELV due to breakdown or accident. • Detailed balances were carried out for PL, SI and CZ to deduct scrappage rates from the data for the car park and the import / export data (broken down by age). • Based on the data available, it is not possible to deduce reliable (national) scrappage rates as a function of the vehicle age. • Such balance is an important tool to conduct evaluations of the car park data, the import / export data and the scrappage rates. • Such evaluation might be possible for other characteristics (motor size / fuel etc.) as far as they are available by age as well.
National Sources + FTS:Patterns for export and import (1/2) Estimated relevance of imports and exports (M1 & N1) compared to new registrations (2008) • The given figures for import and export needs to be considered as a minimum value and in reality more imports / exports are expected to occur.
National Sources + FTS:Patterns for export and import (2/2) • Group 1: BG, CY, CZ, GR, LV, MT, PL, RO and SK: High relevance of imports (≥ 60% compared with the annual registration of new cars) and low relevance (< 15%) of exports. • Group 2: FI, HU, IE: Imports are of medium relevance (≥ 16%, ≤ 33%) and exports of small relevance (≤ 2%). • Group 3: DK has both medium imports and medium exports. It is not a typical importer or exporter but apparently is simply well integrated. • Group 4: BE, NL and SI: Imports are of medium relevance (≥ 15%, < 30) and exports of high relevance (≥ 60%; ≥ 52% in the case of LU). • Group 5: AT, DE, ES, FR, IT, PT, SE and UK: Imports are of low relevance (< 15%). Germany, with its high share of exports (55%), is somewhat an exception in this group. • Group 6: LT is seemingly an exception as it appears to be a shipment centre with high imports from EU 27 and high exports to extra-EU countries; in terms of net imports (around 155%) it is in the range of LV and GR. • The given figures for import and export need to be considered as a minimum value and in reality more imports / exports are expected to occur. • More details on sources and estimations are provided in the main report and Annex 5 (see slide references).
First conclusions (1/2) • Extra EU 27 trade seems less relevant (for most countries) compared to the intra EU 27 trade. • Data on intra EU 27 trade of used cars is limited, some experts explicitly state to have no information at all (e.g. Austria). A number of other countries did not contribute to the survey. • However it is obvious that the order of magnitude of the cross border trade effects the composition of many national car parks, with the effect that importing countries stick to have old car parks with highemissions and exporting countries have newer car parks. • Detailed information on motor type/size, kilometres, emission class and economic value of used vehicles is comparatively rare. Should the situation not improve, we recommend relying on vehicle age as an indicator for emission classes and other characteristics.
First conclusions (2/2) • Eurostat’s data refers to age classes (<2 ys, 2 <5ys, 5 <10ys, 10ys and older). Such age classes are not appropriate for a detailed evaluation of the car park evolution and the derivation of scrappage rates, respectively fleet exit rates. • In particular the aggregate for older vehicles referring simply to “≥ 10 years” is not appropriate as for some countries the majority of the car park (and the imported cars) are older. • In consequence we recommend establishing a database / collection with a breakdown of at least 16 age classes (a breakdown by single years of age up to <15 years and one class ≥15 years). • According to our experience, such a detailed breakdown is available to the national registration authorities (even backwards) so that it is a question of aggregation and data management rather than a question of data collection. • We recommend to conduct balance evaluations of the car park data in combination with import / export and scrappage data.
Commercial Sources • For the calculation of a European scrappage rate a data set has been purchased for 23 Member States for the years 2004 to 2009, providing for each year a detailed break down by age (up to the age of 14 ys) but excluding BG, RO, MT, CY. 1) • The general idea of the model is that by aggregating all relevant countries, imports and exports will net out, and total exits in one age group from one year to the next year will be an “average European scrappage rate” • The effects of the extra EU trade and the missing countries have been estimated. • Based on this calculations an estimate on the net import (including a break down by age) has been calculated for the 23 Member states.
Scrappage function: Methodology Sum of vehicles (M1 + N1), 2004 - 2009 by age group. Scrappage rates for EU (M1 + N1), 2005 - 2009. Average scrappage rates for EU (M1 + N1), 2005 - 2009.
Scrappage function: Adjustments Romania, Bulgaria, Malta and Cyprus and extra EU countries are not included in the POLK database and therefore not included in the calculations above. Based on other sources the net exports to these countries are estimated to be at least: • 150 000 vehicles to Bulgaria, • 180 000 vehicles to Romania, • 720 000 vehicles to countries outside EU (all M1+N1). Adjusting for these exports reduces the scrappage rates and increase exports from EU countries.
Generic net import Net exporters of vehicles (M1+N1), average number of vehicles 2004 - 2009 Note: Export reported as negative figures, import reported as positive figures; adjusted for additional export.
Generic net export Net importers of vehicles (M1+N1), average number of vehicles 2004 - 2009 Note: Export reported as negative figures, import reported as positive figures; adjusted for additional export.
Generic net export Large net importers of vehicles (M1+N1), average number of vehicles 2004 - 2009 Note: Export reported as negative figures, import reported as positive figures; adjusted for additional export.
Generic net export Net vehicle imports (M1+N1) in percentage of the total car park, average 2004 - 2009 Note: Export reported as negative figures, import reported as positive figures; adjusted for additional export.
Generic net export Large net importers of vehicles (M1+N1), average number of vehicles 2004 - 2009 Note: Export reported as negative figures, import reported as positive figures; adjusted for additional export.
Generic net export • The analysis gives robust information on the internal imports and exports in the EU. • Cross checks with other sources confirmed the order of magnitude. • The assumption of similar scrappage rates in the same age group in all countries may not be correct: • In countries with heavily taxed cars or other economic conditions, it may be argued that repair costs are lower compared with the capital cost leading to lower scrap rates. • It is recommended to take the calculations as a first estimate only, where national sources are required to provide more evidence.
Second conclusions (1/2) • For modelling purposes it is strongly recommended to separate the real “scrappage rate” from the “net import/export rate”. • We recommend applying the following definitions: • “fleet exit rate” including scrappage and net import / export • “scrappage rate” considering effective scrappage only (i.e. ELV due to breakdown or accident). • To model scrappage, we recommend – with respect to the current (incomplete) data situation – to use the generic European scrappage rate which was demonstrated to yield probable results. • To model / forecast import / export, economic drives have been (unsuccessfully) tested. Thus the only opportunity is to apply the (generic) calculated import / export rates as derived from the commercial data. • As the data coverage and reliability is still weak, the intervals between model updates with empirical data should be reduced. A delay of five years and more is not appropriate.
Second conclusions (2/2) • However it should be the aim to improve the availability of coherent data on car park, import / export and scrappage. • Regarding data on the national fleets the freely available international sources are found to be of limited reliability in particular when a breakdown by age is required. • Hence, reference to national sources is recommended to ensure appropriate quality. • Commercially available fleet data might be an additional source but licensing practices may limit their free use. • Once the data situation on the national fleets and exports/imports as a function of age is more complete, detailed balances on the national level can be used to verify the underlying assumption of a constant scrappage rate for all Member States.
Reference The study has been commissioned in 2010 by the European Commission, DG Climate Action, in cooperation with DG Environment and Eurostat with the contract number 07.0307/2009/549021/SER/C5 The full report, prepared jointly by Öko-Institut e.V. (Germany), TML (Belgium) and COWI (Denmark) is called: “European second-hand car market analysis” Report, including an executive summary of 10 pages at the very beginning (1 MB) http://ec.europa.eu/clima/studies/transport/vehicles/docs/2010_2nd_hand_car_en.pdf or http://www.oeko.de/oekodoc/1114/2011-005-en.pdf Data, excluding the data commercially available only (5 MB) http://ec.europa.eu/clima/studies/transport/vehicles/docs/2010_2nd_hand_car_data_en.zip or http://www.oeko.de/oekodoc/1116/2011-006-en.zip
Thank you for your attention! Dr.-Ing. Georg MehlhartÖko-Institut e.V. Rheinstraße 95Germany E-mail: g.mehlhart@oeko.de Phone: +49 6151/8191-153