Download
1 / 21
210 likes | 305 Views
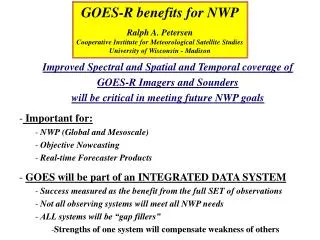
Polar Winds from Satellite Imagers and Sounders. MODIS Winds Group: Jeff Key 1 , David Santek 2 , Christopher Velden 2 , Lars Peter Riishojgaard 3 , Paul Menzel 1 Sounder Winds Group: Cheng-Zhi Zou 1 , Mark DeMaria 1 , and Jennifer Francis 4

E N D
Polar Winds from Satellite Imagers and Sounders MODIS Winds Group: Jeff Key1, David Santek2, Christopher Velden2, Lars Peter Riishojgaard3, Paul Menzel1 Sounder Winds Group: Cheng-Zhi Zou1, Mark DeMaria1, and Jennifer Francis4 1Center for Satellite Research and Applications, NOAA/NESDIS 2Cooperative Institute for Meteorological Satellite Studies (CIMSS), Madison 3NASA Global Modeling and Assimilation Office 4Rutgers University
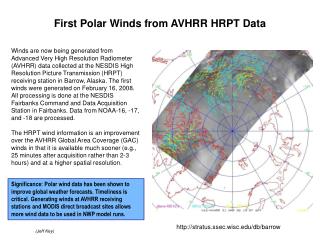
MODIS winds filling observing system void Being used operationally since Jan 2003
MODIS Polar Winds 500 hPa geo potential North Atlantic Europe ECMWF pre-op tests in 2002
Forecast Busts (GMAO) Southern Hemisphere Extratropics Arctic Blue is forecast with MODIS winds; red is control run
AVERAGE HURRICANE TRACK ERRORS (NM) FREQUENCY OF SUPERIOR HURRICANE PERFORMANCE (%)* • Percent of cases where the specified run had a more accurate hurricane position than the other run. Note: These cases are for hurricanes in the subtropics.
Using Winds in Operational Forecast Systems: • European Centre for Medium-Range Weather Forecasts (ECMWF) • NASA Global Modeling and Assimilation Office (GMAO) • Japan Meteorological Agency (JMA) • Canadian Meteorological Centre (CMC) • US Navy, Fleet Numerical Meteorology and Oceanography Center (FNMOC) • UK Met Office • National Centers for Environmental Prediction (NCEP/EMC & JCSDA) Other: • Deutscher Wetterdienst (DWD; Alexander Cress) – Using winds in experimental system • NCAR Antarctic Mesoscale Model (AMPS; Dale Barker) – Using the winds over Antarctica MODIS Winds in NWP
The Global Impact of MODIS-Derived Polar Winds in Model Forecasts David Santek What are possible explanations for the global impact of polar wind data? Two areas are being investigated: 1) 3DVAR assimilation 2) Dynamics near the jet stream
3DVAR Effects 24 hours into experiment 6 days into experiment Wind speed difference between GFS model runs with and without the MODIS winds at 800 hPa. Yellow is close to zero difference; brown to black is up to a +7 m/s difference; green to blue is –1 to –6 m/s difference. Results are based on analyses, not forecasts.
The MODIS are winds are derived in an area generally poleward of the polar jet streams, where conventional weather observations are relatively scarce. Tracking cloud and water vapor features provides predominantly upper-tropospheric wind information. The winds measured are the true winds, including the ageostrophic component. This is unlike sounder winds which are in thermal, geostrophic balance (at least as we currently calculate them). When the winds are assimilated, a mass adjustment takes place. Most of the mass adjustment takes place near and poleward of the jet stream. For the following example, this is also in the region where the ageostrophic wind differs. Dynamics near the Jet Stream
Wind Differences Geostrophic difference Ageostrophic difference Differences between the control and MODIS winds model runs for the 500 hPa geostrophic and ageostrophic winds.
1000-500 hPa Thickness Differences 1000-500 hPa thickness difference between control and MODIS winds analyses. The range from blue to red is from -30 to +30 gpm difference. 500 hPa height contours in black. White shading indicates 30 m/s wind speed.
Effects into the Mid- and Low-Latitudes HurricaneIvan Forecast out 5 days in 6-hour increments.
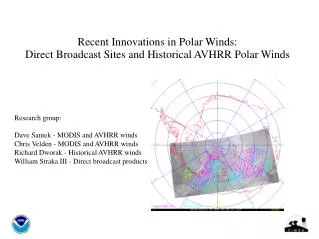
Direct Broadcast MODIS Polar Winds MODIS winds do not meet 3 hr cut-offs of most regional/limited area data assimilation systems. Possible solution: generate winds at high-latitude direct broadcast stations. • Northern Hemisphere - Fairbanks (NOAA); Tromsø, Norway (Ksat); Soldankylä, Finland (FMI) • Southern Hemisphere - McMurdo, Antarctica (NSF; operational); Troll, Antarctica (Norway) See the poster!
This EOS project also seeks to estimate winds in the polar regions from atmospheric sounders. The methodology for deriving winds from sounders involves estimating the temperature and moisture fields from retrievals, and then applying hydrostatic and dynamical balance constraints; i.e., calculate a thermal wind and correct for mass conservation. A surface or upper-level wind from a model analysis or from satellite data is used as a boundary condition, and thermal winds are sequentially added upwards or downwards. Wind retrieval methods developed for soundings from TOVS (at right) and AMSU are being applied to the polar regions. Improved soundings from AIRS are also being investigated. Sounder Winds TOVS Winds Over the Arctic
Trends from TOVS Jennifer Francis and Cheng-Zhi Zou Thermal winds have been calculated for 22 years of TOVS data. This dataset can be used to examine trends in Arctic circulation, as illustrated below. Trends in total column u and v wind components for the period 1979-2001 show that the polar vortex has strengthened and shifted toward central Siberia. The next version will combine TOVS thermal winds and AVHRR feature-tracked winds.
Wind Retrievals from AMSUMark DeMaria and Jack Dostalek AMSU-derived 500-hPa heights and geostrophic winds for 0015 UTC 17 December 2004. GFS analysis of 500-hPa heights and geostrophic winds for 0000 UTC 17 December 2004.
Summary • The MODIS winds retrieval method continues to be refined. A parallax correction is being tested, and Terra and Aqua MODIS data streams will be combined. • The MODIS winds are used operationally by seven NWP centers in four countries. • MODIS winds are also calculated at the McMurdo, Antarctica DB site, with more sites to come. • Methods to calculate thermal winds from sounders are being refined. Case studies have been performed with AMSU. TOVS winds have been calculated for a 20+ year period. • MODIS winds will be used as a boundary condition in the AIRS thermal wind approach (Cheng-Zhi Zou and Weizhong Zheng). • Historical AVHRR winds are being merged with TOVS winds.
Progress in Sounder Wind Profile Retrievals Using MODIS Winds as Boundary Conditions Cheng-Zhi Zou and Weizhong Zheng • Algorithm utilizes the thermal wind relationship plus the University of Washington Planetary Boundary Layer Model (UWPBL 4.1). • Boundary conditions set up near mid-troposphere to use any wind source. Future studies will use MODIS winds and AIRS temperature retrievals as inputs to derive satellite wind profiles. • Derive first-guess atmospheric wind profiles including surface winds. • Lagrange multipliers in a variational formalism are then used to force the first-guess wind to conserve mass.
Comparison of Surface Winds over the Polar Region FNL Derived