Download
1 / 26
260 likes | 304 Views
Mission to promote the economic and social well-being of the city, its people, and its neighborhoods. 501(c)3 non-profit created in 1992 Public/Private Partnership. Who is ProvPlan?. “Information for Change” Agenda Information intermediary and community convener

E N D
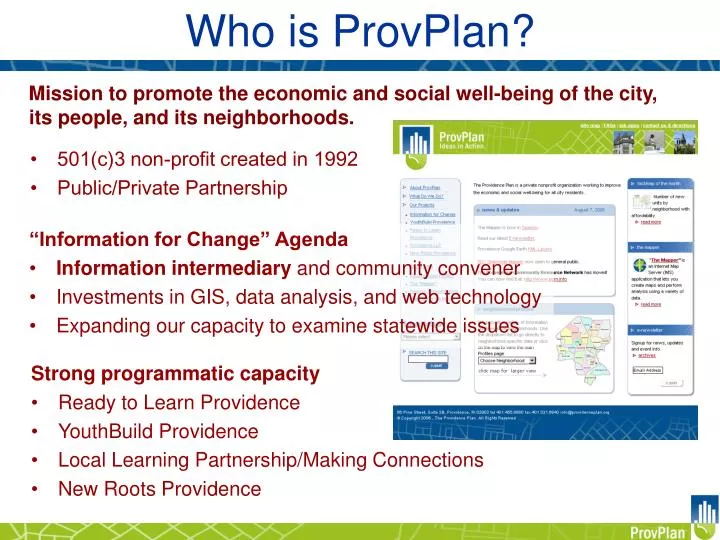
Mission to promote the economic and social well-being of the city, its people, and its neighborhoods. • 501(c)3 non-profit created in 1992 • Public/Private Partnership Who is ProvPlan? “Information for Change” Agenda • Information intermediary and community convener • Investments in GIS, data analysis, and web technology • Expanding our capacity to examine statewide issues Strong programmatic capacity • Ready to Learn Providence • YouthBuild Providence • Local Learning Partnership/Making Connections • New Roots Providence
Linking people information with place information NEIGHBORHOODS WARDS • Demographics • Jobs/Employment CITY • Property/Land Use CENSUS • Education POLICE POSTS • Public Health PARCEL • Public Safety • Quality of Life
Providence is growing,becoming more diverse, and getting younger. • The city grew by 8%, the state only by 4.5%. • Fastest growing city in New England and now 2nd largest. Minority pop. increased 65% – City now 45% non-Hispanic White. Hispanic growth – Population doubled since 1990, now 30% of city. City has 17% overall state pop. – and 50% of state minority pop. 1 in 4 people in city under 18 – 11% increase since 1990. Under 18 population is 75% minority – and 45% Hispanic.
Population Change by Neighborhood, 1990-2000 as Percent of Neighborhood Population Providence, RI Neighborhood Pop. 1990 - 2000 Total Growth: 12,890 Source: U.S. Census 1990, 2000 Redistricting Data
Change in Hispanic Population by Neighborhood, 1990-2000 as Percent of 1990 Neighborhood Hispanic Population Providence, RI Hispanic Pop. 1990 - 2000 Citywide Hispanic Population Change: 27,164 Source: U.S. Census 1990, 2000 Redistricting Data
Change in Non-Hispanic White Population by Neighborhood, 1990-2000 as % of 1990 Neighborhood Non-Hispanic White Population Providence, RI N.H.White Pop. 1990 - 2000 Non-Hispanic White Population Change: -24,324 Source: U.S. Census 1990, 2000 Redistricting Data
Change in Black/African American Population by Neighborhood, 1990-2000 as Percent of 1990 Neighborhood Black/African American Population Providence, RI Black/AA Pop. 1990 - 2000 Black/African American Population Change: 1,415 Source: U.S. Census 1990, 2000 Redistricting Data
EDUCATION Providence suffers from low student achievement, significant student mobility, and a high dropout rate. • 38 of 45 schools were in need of improvement as ofSchool Year 2003-04; only 2 were high performing. • 15 schools were improving or making progress, but almost twice as many (29) showed insufficient progress. • The district had a SY2004-05 school mobility rate of 36% compared to 17% statewide. - Mobility rate is the total number of students entering or leaving a school between October 1st and June 1st divided by the average daily membership in the school. The district had a SY2004-05 dropout rate of 27% compared to 15% statewide.
Providence School Department Enrollment, 1987-2005 Source: Providence School Department
High School Graduate or Higher, 2000Providence, RI Neighborhoods City rate: 65.8% State rate: 78.0% Universe: Population over 25 years. Source: Census 2000 SF3
Median Family Income in Providence City: $32, 058 State: $54,781 Incomes in Providence grew 2.5 times slower than the state rate. When adjusted for inflation, median family income in the city actually decreased by 6%. Providence has the largest concentration of both low-income and high-income families in RI. 40% of children in the city live in poverty (3rd highest in the nation). Child poverty rate in RI is 17%. Numbers on map indicate median family income for block groups rounded to nearest $1,000. Source: Census 2000 SF3
Unemployment in Providence City rate: 9.3% State rate: 5.6% Half the city’s neighborhoods have areas of unemployment 20% or higher. RI has the lowest rate of functional adult literacy according to a recent study. Only 1 in 5 new jobs in RI were located in Providence (1994-2001). Numbers on map indicate percent of civilian labor force unemployed for block groups. Source: Census 2000 SF3
“The Housing Scene” • Assessment values increased by 47% Greatest growth has occurred on the East Side and South Side. Number of vacant units down by 30% Poorer neighborhoods improved, but still have higher vacancy rates. Home ownership rates remain low and stagnant City rate is 34%. RI rate is 60%, and the national rate is 66%. Lead levels experience steady decline Incidences of new lead poisoning for children under six declined from 25.6% in 1995 to 6.3% in 2004. RI had 3.7% new cases in 2004.
Since 2000 • 2,796 new units residential units between Jan ’02 and June ‘05 Citywide median residential sales price more than tripled between 2000 and 2005 Risk of foreclosures, subprime lending, and long waiting lists for public housing remain.
New Residential Units Number by Neighborhoodwith AffordabilityJanuary 1, 2002 – June 30, 2005 NOTE: Affordability determined by organizational contact in DIS database and designation in DPD "Development Prospects" document (or through DPD correspondence). Source: Department of Inspection & Standards (Permit Database) and Department of Planning & Development Analysis by ProvPlan
The East Side remains the most expensive neighborhood to rent, but a two bedroom anywhere in the city will cost at least $1000, according to the 2005 Year End Rent Survey conducted by RI Housing.
Median Family Income – 2005 Dollars (Adjusted for Inflation) +4.7% vs 1999 -0.2% vs 1989 +4.5% vs 1989 +10.4% vs 1999 -16.2% vs 1989 -7.5% vs 1989 1989 1999 2005 1989 1999 2005 Sources: 1990 & 2000 US Censuses, 2005 American Community Survey, Bureau of Labor Statistics Consumer Price Index
www.provplan.org Thank you for your time. This information and much more is available on our website: