Download
1 / 6
60 likes | 167 Views
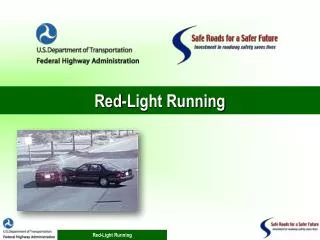
Red Light Running Fatalities in the United States (2000-2009) * Fatality Analysis Reporting System (FARS). Red Light Running Fatalities in the United States (2000-2009). Proportions of Red Light Running Fatalities to Total Fatalities in the United States (2000-2009)

E N D
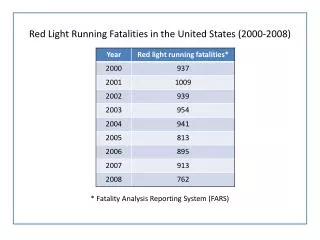
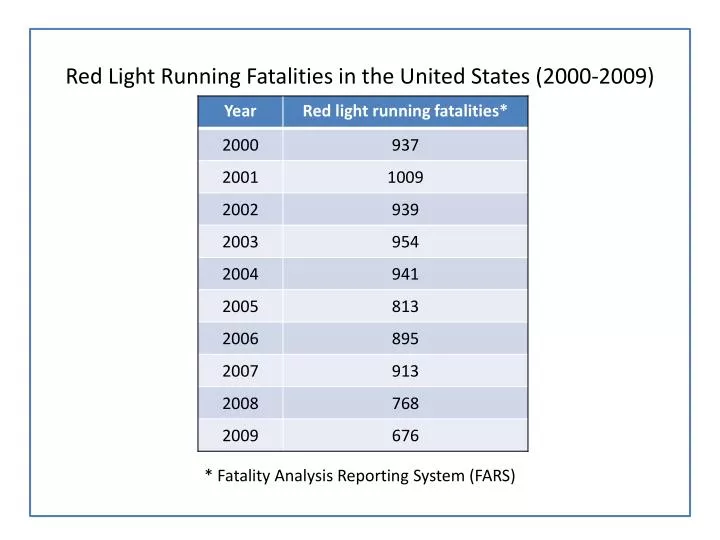
Red Light Running Fatalities in the United States (2000-2009) * Fatality Analysis Reporting System (FARS)
Red Light Running Fatalities in the United States (2000-2009)
Proportions of Red Light Running Fatalities to Total Fatalities in the United States (2000-2009) • Fatality Analysis Reporting System (FARS) • NOTES: • RLR intersection fatalities include FARS “Relation to Junction” attributes 2) intersection (non-interchange), 3) intersection related (non-interchange), and 4) driveway, alley access, etc. (non-interchange). • Intersection fatalities include FARS “Relation to Junction” attributes 2) intersection (non-interchange) and 3) intersection related (non-interchange).
Proportions of Red Light Running Fatalities to Total Fatalities in the United States (2000-2009)
Proportions of Red Light Running Fatalities to Intersection Fatalities in the United States (2000-2009) • NOTES: • RLR intersection fatalities include FARS “Relation to Junction” attributes 2) intersection (non-interchange), 3) intersection related (non-interchange), and 4) driveway, alley access, etc. (non-interchange). • Intersection fatalities include FARS “Relation to Junction” attributes 2) intersection (non-interchange) and 3) intersection related (non-interchange).
Proportions of both Red Light Running Fatalities to Total Fatalities and Red Light Running Fatalities to Intersection Fatalities in the United States (2000-2009) • NOTES: • RLR intersection fatalities include FARS “Relation to Junction” attributes 2) intersection (non-interchange), 3) intersection related (non-interchange), and 4) driveway, alley access, etc. (non-interchange). • Intersection fatalities include FARS “Relation to Junction” attributes 2) intersection (non-interchange) and 3) intersection related (non-interchange).