Download
1 / 15
150 likes | 553 Views
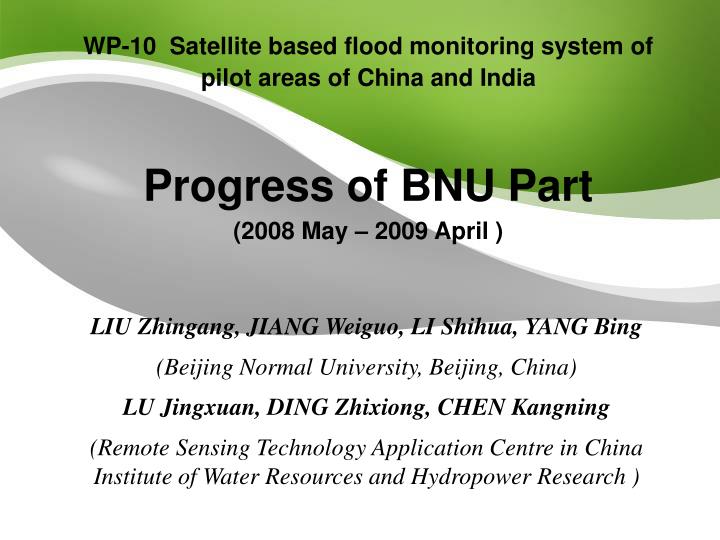
WP-10 Satellite based flood monitoring system of pilot areas of China and India Progress of BNU Part (2008 May – 2009 April ). LIU Zhingang, JIANG Weiguo, LI Shihua, YANG Bing (Beijing Normal University, Beijing, China) LU Jingxuan, DING Zhixiong, CHEN Kangning

E N D
WP-10 Satellite based flood monitoring system of pilot areas of China and IndiaProgress of BNU Part(2008 May – 2009 April ) LIU Zhingang, JIANG Weiguo, LI Shihua, YANG Bing (Beijing Normal University, Beijing, China) LU Jingxuan, DING Zhixiong, CHEN Kangning (Remote Sensing Technology Application Centre in China Institute of Water Resources and Hydropower Research )
Description of Work • Task 10.1. Early flood warning using surface wetness indicator derived from satellite data (ULP, BNU); • Task 10.2. Real time flood forecasting using data from the atmospheric-hydrologic network (NIH, BNU); • Task 10.3. Mapping and visualizing flood inundation, flood risk using combined satellite data and hydraulic models (BNU, NIH)
Task 10.1. Early flood warning using surface wetness indicator derived from satellite data Development of the surface wetness indicator Collect the flood information of last 30 years at Yangtze River (BNU) Times series analysis (ULP, BNU ) Case studies (ULP, BNU ) Finished Partly-Finished Unfinished
Task 10.2. Real time flood forecasting using data from the atmospheric-hydrologic network Time series analysis of historical hydro-meteorological data Data have been collected Heihe River (BNU ) Xiangjiang River (BNU ) Development of flood forecasting models Black-Box Kalman filters ANN/ Fuzzy logic (BNU) ANN model has been developed. Case studies (ULP, BNU ) Finished Partly-Finished Unfinished
Task 10.3. Mapping and visualizing flood inundation, flood risk using combined satellite data and hydraulic models Simulation of flood inundation, depth and areal extent (BNU: Xiangjiang River) Mapping flood inundated area (BNU: Xiangjiang River) flood inundation, flood hazard and flood risk map (BNU: Xiangjiang River) Case study (BNU ) Finished Partly-Finished Unfinished
Hydrologic data Remote Sensing image DEM Remote Sensing image Socio-Economic data Hydro-dynamic model (HEC-RAS) Population Land use Floodarea Flood depth Economic Value map Population density map Flood frequency Assessment method Hazard factors data Vulnerability factors data Flood risk assessment and impact evaluation model Finished Flood impact analysis Flood risk analysis Partly-Finished Unfinished Flood risk and impact maps
The Changsha channel segment of Xiang Jiang River is selected as study area in Hunan Province of China Xiang Jiang River Changsha
Jun 28, 1998 • Collect the historical hydrologic data of the Changsha channel segment of Xiang Jiang River • Study their change statuses and analysis their development trends through the Time series analyzing method. Time Series Analysis for Water Level of the Observation Station
topography maps • Buy the 12 scenes of scale 1:10,000 topography maps (DRG format) • Digitize and process it from Raster into Vector format data (with ArcGIS 9.x software).
the River Analysis System of Hydrologic Engineering Centers (HEC- RAS)
Risk : “Expected losses (of lives, persons injured, property damaged, and economic activity disrupted) due to a particular hazard for a given area and reference period. Based on mathematical calculations, Risk is the product of hazard and vulnerability”. Where Hazard : A threatening event, or the probability of occurrence of a potentially damaging phenomenon within a given time period and area Vulnerability : Degree of loss resulting from a potentially damaging phenomenon. ----United Nations Department ofHumanitarian Affairs, 1992 Risk Evaluation Method