Download
1 / 11
110 likes | 176 Views
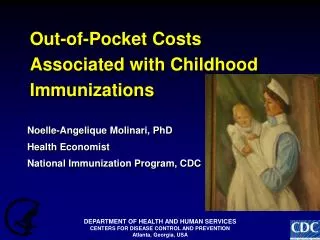
Spent > 10% of income, or > 5% of income if low-income*. Spent > 10% of income. Figure ES-1. Nearly One of Six Families Spent 10% or More of Income (or 5% or More if Low-Income) on Out-of-Pocket Medical Costs, 2001–02. Percent of families with high out-of-pocket medical costs

E N D
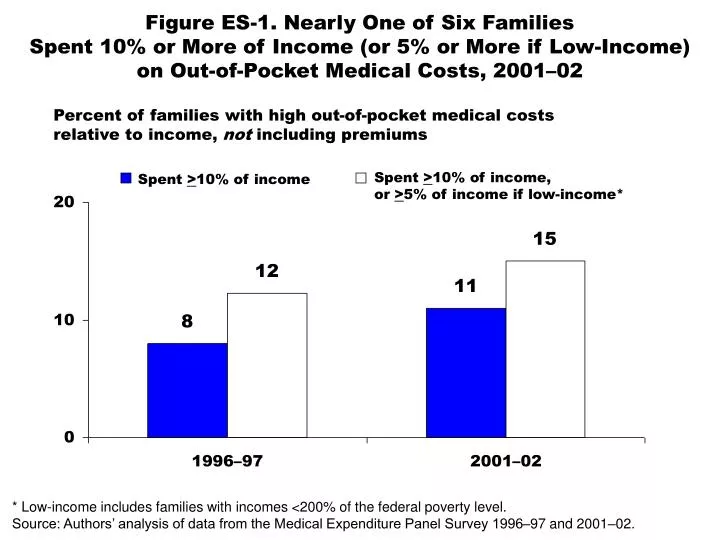
Spent >10% of income, or >5% of income if low-income* Spent >10% of income Figure ES-1. Nearly One of Six FamiliesSpent 10% or More of Income (or 5% or More if Low-Income)on Out-of-Pocket Medical Costs, 2001–02 Percent of families with high out-of-pocket medical costs relative to income, not including premiums * Low-income includes families with incomes <200% of the federal poverty level. Source: Authors’ analysis of data from the Medical Expenditure Panel Survey 1996–97 and 2001–02.
Spent 5% to <10% of incomeif low-income* Figure ES-2. Including Premiums, One of Four FamiliesHad High Costs Relative to Income, 2001–02 Percent of families with high out-of-pocket medical costs and premiums relative to income Spent >10% of income 23 17 15 10 All families All family members under age 65 OOP = out-of-pocket. * Low-income includes families with incomes <200% of the federal poverty level. Source: Authors’ analysis of data from the Medical Expenditure Panel Survey 2001–02.
Spent >10% of income, or >5% of income if low-income* Spent >10% of income Figure 1. Nearly One of Six FamiliesSpent 10% or More of Income (or 5% or More if Low-Income)on Out-of-Pocket Medical Costs, 2001–02 Percent of families with high out-of-pocket medical costs relative to income, not including premiums * Low-income includes families with incomes <200% of the federal poverty level. Source: Authors’ analysis of data from the Medical Expenditure Panel Survey 1996–97 and 2001–02.
Spent 5% to <10% of income if low-income* Spent >10% of income Figure 2. One of Ten Nonelderly Families and One-Third ofElderly Families Had High Out-of-Pocket Health Care Costs Relative to Income, 2001–02 Percent of families 34 15 10 * Low-income includes families with incomes <200% of the federal poverty level. Source: Authors’ analysis of data from the Medical Expenditure Panel Survey 2001–02.
Spent >10% of income Spent 5% to <10% of income if low-income* Figure 3. One-Fifth or More Nonelderly Families with Health Problems Spent a High Portion of Income on Health Care Percent of nonelderly families 34 22 21 10 6 ADLs = activities of daily living; IADLs = instrumental activities of daily living. * Low-income includes families with incomes <200% of the federal poverty level. Source: Authors’ analysis of data from the Medical Expenditure Panel Survey 2001–02.
Spent 5% to <10% of income if low-income* Spent >10% of income Figure 4. Low-Income Families at High Riskfor Burdensome Out-of-Pocket Costs Percent of nonelderly families 38 23 10 _ Family income as percentage of poverty * Low-income includes families with incomes <200% of the federal poverty level. Source: Authors’ analysis of data from the Medical Expenditure Panel Survey 2001–02.
Figure 5. Out-of-Pocket Exposure Increased over Past Five Years for Insured and Uninsured Families, 1996–97 vs. 2001–02 Percent of nonelderly families who spent >10% of income, or >5% of income if low-income* * Low-income includes families with incomes <200% of the federal poverty level. Source: Authors’ analysis of data from the Medical Expenditure Panel Survey 1996–97 and 2001–02.
Figure 6. Over the Course of Two Years, One of Seven Individuals in Nonelderly Families Faced High Spending Percent of individuals in a nonelderly family who spent >10% of income, or >5% of income if low-income* (Either or both years) * Low-income includes families with incomes <200% of the federal poverty level. Source: Authors’ analysis of data from the Medical Expenditure Panel Survey 2001–02.
Spent 5% to <10% of incomeif low-income* Spent >10% of income Figure 7. Including Premiums, One of Four FamiliesHad High Costs Relative to Income, 2001–02 Percent of families with high out-of-pocket medical costs and premiums relative to income 23 17 15 10 All families All family members under age 65 OOP = out-of-pocket. * Low-income includes families with incomes <200% of the federal poverty level. Source: Authors’ analysis of data from the Medical Expenditure Panel Survey 2001–02.
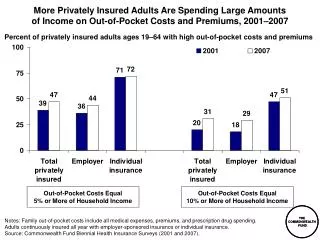
OOP only OOP plus premiums Figure 8. Total Out-of-Pocket Costs and Premium Costs forNonelderly Families with Private Health Insurance, 2001–02 Percent of nonelderly families with private health insurance who spent >10% of income, or >5% of income if low-income* _ OOP = out-of-pocket. * Low-income includes families with incomes <200% of the federal poverty level. Source: Authors’ analysis of data from the Medical Expenditure Panel Survey 2001–02.
OOP spending only OOP spending plus premiums Figure 9. Two of Five Families with Private Nonemployer Coverage Face High Costs When Premiums Are Included Percent of nonelderly families with nonemployer coverage _ _ _ Amount spent on bills and premiums OOP = out-of-pocket. * Low-income includes families with incomes <200% of the federal poverty level. Source: Authors’ analysis of data from the Medical Expenditure Panel Survey 2001–02.