Download
1 / 14
140 likes | 242 Views
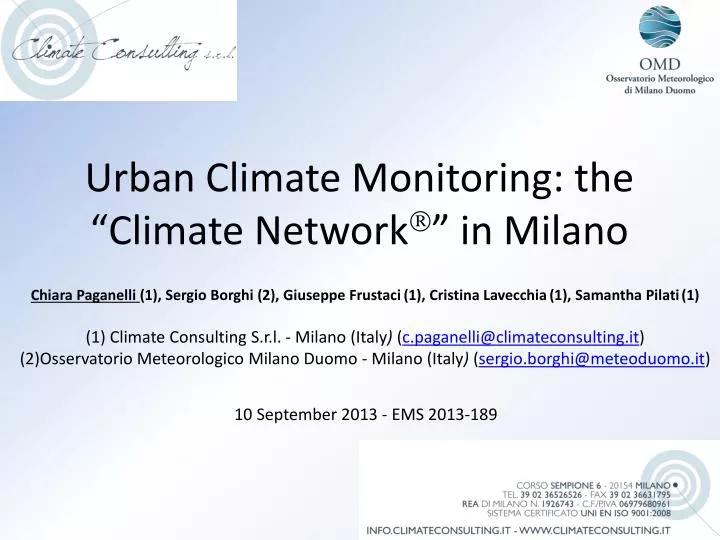
Urban Climate Monitoring : the “ Climate Network ” in Milano. Chiara Paganelli (1), Sergio Borghi (2), Giuseppe Frustaci (1), Cristina Lavecchia (1) , Samantha Pilati (1) (1) Climate Consulting S.r.l. - Milano ( Italy ) ( c.paganelli@climateconsulting.it )

E N D
Urban Climate Monitoring: the “Climate Network” in Milano Chiara Paganelli (1), Sergio Borghi (2), Giuseppe Frustaci(1), Cristina Lavecchia(1), Samantha Pilati(1) (1) Climate Consulting S.r.l. - Milano (Italy) (c.paganelli@climateconsulting.it) (2)Osservatorio Meteorologico Milano Duomo - Milano (Italy) (sergio.borghi@meteoduomo.it) 10 September 2013 - EMS 2013-189
STRUCTURE OF PRESENTATION • Climate Network: descriptionand importance of monitoring weather data in urban city centres • Study case in Milano area: Heat waves and Urban Heat Island phenomena • Climate Network Future Goals and Potentials • Conclusions and Further Developments Paganelli C. - EMS 2013-189
The Climate Network CN CLIMATE NETWORK : Private and professional network of urban meteorological stations in ITALY. Managed by CLIMATE CONSULTING Srl, company founded in 2010 on the tradition of Osservatorio Meteorologico Milano Duomo (OMD) (ex Brera), existing from 1763. Why monitoring URBAN weather? • Cities are continuosly evolving (due to the rise in city population): • Development of built-up areas and metropolitan areas to the detriment of green areas • Evolution of cities’ needs in terms of: • Energy demand (more heating and cooling electrical consume) • Urban planning • Building construction technologies and building materials Weather data can support the future urban planning and the management of the energetic resources. That’s why CN exists: to provide high quality weather data measured in urban areas!!! Paganelli C. - EMS 2013-189
The Climate Network CN Description • National coverage: Stations located in the main Italian cities in URBAN areas, such as MILANO, TORINO, FIRENZE, ROMA.. • Nowadays (Sep 2013): 32 fixed meteorological stations located on the national territory • Within 2016: 80 fixed meteorological stations and some mobile stations • Variables measured (resolution 10 min): • Temperature (average, min, and max) • Relative Humidity (average, min, and max) • Atmospheric pressure (average, min, and max) • Rain (amount, intensity and duration) • Hail (amout, intensity and duration) • Wind speed and direction (ultrasonic bi-axial sensor) • Solar radiation (global and diffuse) (not in all stations) Paganelli C. - EMS 2013-189
The Climate Network CN KEY STRENGHTS HIGH QUALITY and CONSISTENCY of WEATHER DATA, with HIGH METROLOGICAL STANDARDS. • INTERNAL CALIBRATION LABORATORY: • Using referentialinstrumentscertified by the National Institute of MetrologicalResearch of Torino, we calibrate temperature sensors: • CALIBRATION UNCERTAINTIES are: • UT = 0.14 °C (at 20°C) • HOMOGENEITY OF THE STATIONS: • Samecriteria to placeallstations: terraces or top roofs in city centres (fulfilling WMO/TD-No. 1250 2006 requirements: correct representation of URBAN CANOPY LAYER) • Sametype of weatherstations(VAISALA WXT520) • Samecalibrationmethod for all Temperature sensors. (Poster EMS2013-296-GF61 (ASI6)) First line reference standard: Secondary Reference Platinum ResistanceThermomethercalibratedat INRIM, National Istituteof Metrology in TORINO Second Line reference standard: 3 ResistanceThermometers (PT100 OHM) Oursensor: WeathertrasmitterVaisala WXT520 Paganelli C. - EMS 2013-189
The Climate Network CN AIM • Climate Network(high quality) weather data can supportallurbanactivities/sectorsinfluenced by weatherconditions: • Insurance companies for extrememeteorologicalevents (ex. Hail or cloud-burst…) • Energy companies: to manage energy connected to heating and cooling demand • Urban area’s development leads to: • UHI Urban Heat Islands: urban regions experience warmer temperature than their rural surroundings; • Heat waves (hot and wet days with Tmax > 35°C e Tmin >25°) • (EPA estimated that every increase in summertime temperature of 0.6°C implies an electric demand increase of 1.5 -2%!!!!). • Important economic implications!!! • Building andtrasportsectors Paganelli C. - EMS 2013-189
Ex. Heatwaves in Milano City Centre from 1961 up to 2013: In the last years, the number of heatwavesisdefinitelyrising, up to 16 days of the summer of 2003. Paganelli C. - EMS 2013-189
Weather Urban Network: Milano case • To study the Urban Heat Island phenomenon in Milano area we are implementing a «weather urban network»: • + MILANO AREA (central + surroundings): 20 stations in a maximum radius of 35 km from the centre: • MILANO DOWNTOWN: 8 stations in a radius of 7 km from the «Milano Centro» station Seregno • Weplaced 20 stationsbecause: • Milano ishightlypopulated (5 millioninhabitants in the entire Milano Area) • Milano is in the centre of Po valleythat, due to the orography, generates the atmosphericstability (70% of days/ year) • UHI are frequent and last alotdays!!! Saronno Vimercate Milano Bovisa Legnano Milano Bicocca Cinisello Balsamo Melzo Milano San Siro Milano Sempione Magenta MILANO DOWNTOWN Milano Politecnico Gaggiano San Donato Milano Centro Milano Bocconi MILANO DOWNTOWN Lacchiarella Vigevano Lodi Milano Sud Paganelli C. - EMS 2013-189
Metropolitan Milano Area: AVERAGE HOURLY TEMPERATURE (°C) - 21.08.2012 h. 3:00 – 4.00 pm Seregno Legnano Vimercate Cinisello Balsamo MI-Bovisa Melzo MI-Sempione MI-S.Siro Magenta MI-Polimi T≥ 36°C MI-Centro MI-Bocconi 35°C ≤ T <36°C Milano Dowtown Surrounding Milano Area 34°C ≤ T <35°C Gaggiano MI-Sud 33°C ≤ T <34°C 32°C ≤ T <33°C 31°C ≤ T <32°C 30°C ≤ T <31°C Vigevano Lodi 29°C ≤ T <30°C 28°C ≤ T <29°C Lacchiarella 27°C ≤ T <28°C Paganelli C. - EMS 2013-189
Metropolitan Milano Area: AVERAGE HOURLY TEMPERATURE (°C) - 22.08.2012 h. 0:00 – 1.00 am Seregno Legnano Vimercate Cinisello Balsamo Milano Downtown Surrounding Milano Area MI-Bovisa Melzo MI-Sempione MI-S.Siro Magenta MI-Polimi T≥ 36°C MI-Centro MI-Bocconi 35°C ≤ T <36°C 34°C ≤ T <35°C Gaggiano MI-Sud 33°C ≤ T <34°C 32°C ≤ T <33°C 31°C ≤ T <32°C 30°C ≤ T <31°C Vigevano Lodi 29°C ≤ T <30°C 28°C ≤ T <29°C Lacchiarella 27°C ≤ T <28°C Paganelli C. - EMS 2013-189
CLIMATE NETWORK FUTURE GOALS AND POTENTIALS Supply our customers with weather data (T, RH) for each site within Milano area, not only where we actually placed the stations. HOW: By interpolation method, that can be applied due to the high density of stations in Milano area and good placement criteria First Approach: Interpolation method weighted on the squared distance of the stations from the maximum radius Estimation of the temperature corresponding to a given station by taking the weighted average of the temperatures observed by the surrounding stations. Constrains: the minimum number of the considered surrounding stations needs to be at least 3in a radius maximum than spans from 1 km to 30 km, by recursive range increments of 3 km each. Weight R = maximum radius di = distance Paganelli C. - EMS 2013-189
Application of the thismethod to CLIMATE NETWORK DATA: • DATA: CN mean daily values from June 2012 to May 2013 for all stations in Milano area • Variables considered: Temperature, Relative Humidity For each station weevaluated: differencebetweenmeasured and interpolated temperature values, averaged on a period of 1 year and their standard deviation. Comparisonbetweeninterpolated and measured data In areassurroundingthosestationswhere the annualmeandifference and s in Temperature are COMPATIBLE to MEASUREMENT UNCERTAINTY (0.25°C) itwill be possible to estimate the temperature, withinthoseareas, withoutdirectmeasurements!!! Talk EMS2013-180 (ASI10) Paganelli C. - EMS 2013-189
CONCLUSIONS • CLIMATE NETWORK supplies weather data to all activities influenced by weather conditions, in particular to support energy companies and insurance companies in Italy. • In the future a multi-year database will allow to: • Determine the urban area climatology • Study of analysis models applied to energetic consumes • Implement models for urban planning • Check the efficiency of the plans of adaptation and mitigation adopted FURTHER DEVELOPMENTS • ON DATA ANALYSIS • Development of the interpolation method taking into account also the ALTITUDE of stations’ placement, and not only their LONGITUDE AND LATITUDE. • Use of other interpolation methods • Application of interpolation method on variables, like rain or wind, hightly depending on time and space. • ON STATIONS’ PLACEMENT • Fulfillment of the project of installing a total number of 80 weather stations in the entire national territory. • Duplication the «urban weather network», firstly created in Milano, in other big cities, such as Roma or Firenze. Paganelli C. - EMS 2013-189
THANK YOU VERY MUCH FOR YOUR ATTENTION!!! Genoa aquarius station Vigevano Piazza Ducalestation www.climateconsulting.it Paganelli C. - EMS 2013-189