1 / 1

Sahar Moghimi, MS , et.al

neola
Download Presentation

Sahar Moghimi, MS , et.al

An Image/Link below is provided (as is) to download presentation Download Policy: Content on the Website is provided to you AS IS for your information and personal use and may not be sold / licensed / shared on other websites without getting consent from its author. Content is provided to you AS IS for your information and personal use only. Download presentation by click this link. While downloading, if for some reason you are not able to download a presentation, the publisher may have deleted the file from their server. During download, if you can't get a presentation, the file might be deleted by the publisher.

E N D

Presentation Transcript


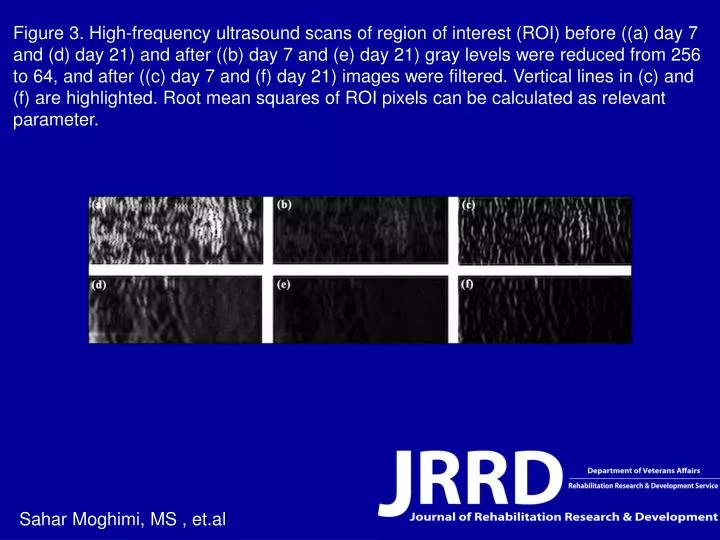
  1. Figure 3. High-frequency ultrasound scans of region of interest (ROI) before ((a) day 7 and (d) day 21) and after ((b) day 7 and (e) day 21) gray levels were reduced from 256 to 64, and after ((c) day 7 and (f) day 21) images were filtered. Vertical lines in (c) and (f) are highlighted. Root mean squares of ROI pixels can be calculated as relevant parameter. Sahar Moghimi, MS , et.al

More Related