Download
1 / 29
290 likes | 405 Views
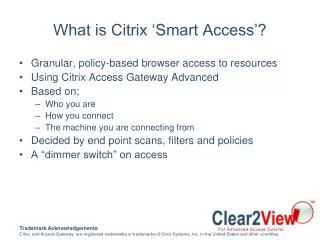
ProactiveWatch Evaluation Guide for Citrix Access Essentials VARs. Contents of This Presentation. ProactiveWatch Overview (Features and Benefits) Installing and Evaluating ProactiveWatch at your Customer Sites Using the Explorer To Manage the Servers at Your Customer Sites (seeing the value)

E N D
ProactiveWatchEvaluation Guide forCitrix Access Essentials VARs
Contents of This Presentation • ProactiveWatch Overview (Features and Benefits) • Installing and Evaluating ProactiveWatch at your Customer Sites • Using the Explorer To Manage the Servers at Your Customer Sites (seeing the value) • Evaluation Program, Pricing, Billing, and Subscription Terms
ProactiveWatch Overview Features and Benefits
ProactiveWatch • Software As A Service monitoring and diagnostics solution for clients w/ IT Staff • Co-branded with your logo • Recurring revenue • Solution for improved support for clients where you are IT Dept. • Faster, more accurate resolution (lower cost) • Helps you meet/exceed SLAs • Platform facilitating Managed Services Offering While providing Perfect Visibility into customer systems • Sell more projects • Proactively sell more capacity (H/W & S/W)
Our Partners say… • “ProactiveWatch alerts me as to every change on my clients’ systems” – Joe Jessen, Director of Professional Services, Gotham Technology Group • “We use ProactiveWatch to support the entire infrastructure at our clients' sites, which helps us ensure the smooth operation of their Sage MAS 90/200 ERP applications” – Kevin Page, IT Consultant, NextStep Technology Advisors • “With ProactiveWatch I see all of my customers’ systems on one pane of glass” – Mike Morlock, Director of Engineering, Globalquest Solutions • "ProactiveWatch generates a new recurring revenue stream for our business, and is instrumental in keeping us in front of our customers” –Douglas Horne, Senior Technology Consultant, D.A. Rainsberger Co.
Sell Managed Services bundled with ProactiveWatch Build a recurring revenue stream by selling a subscription Make Block Time and T&M Support more efficient Each ten server customer is $450/month in revenue and $300/month in Gross Profit Reduce cost of delivering support and increase billable utilization of engineers Leverage “Perfect Visibility” into all three types of accounts and sell the customer more profitable projects justified by ProactiveWatch analytics Create a recurring revenue support and services business Four Ways To Profit From ProactiveWatch
Key Business Benefits • Customer Loyalty – see all of your customers on one pane of glass(your competitors do not) • Drive Services Revenue - know about changes that occur to your customers’ systems to pitch projects pro-actively • Drive profitability - build recurring revenue stream selling ProactiveWatch subscriptions to your larger customers • No Risk - No investment in back end infrastructure for you or your clients • Simplicity – our business relationship is a simple monthly subscription (no yearly contracts or commitments) • Flexibility – employ “unused” agents to deliver improved support, or kickstart Managed Services without risk/cost
Monitoring Details What We Monitor How We Monitor • Availability • Networks, Servers, Disks, Services, Processes, Application Crashes, Remote Site on or off Internet • Performance • CPU, Memory, Client to Server and Internet Latency • Integrity • System Profile Changes • Application Installs/Uninstalls • Registry Changes • Reboots (during the wrong times) • Ports (desired and banned) • Agents poll every 10 seconds • Normal data is cached and forwarded every 5 minutes • Abnormal data (alerts) forwarded immediately • Approx. 1K of data per hour/agent (normal) • No business data of any kind is collected • All data is forwarded by the Gateway to the ProactiveWatch Servers over SSL (443)
How is ProactiveWatch Deployed? • Back end application servers and databases hosted by us • Install Agents on Citrix Servers, Windows Servers, Unix Servers, and (optionally) Windows Clients • Install one Gateway (a Windows Service) per customer site • VAR Console(s) allow you to see all customers on one pane of glass • Customer Console for clients who have an admin or admin staff • No firewall ports need to be opened to make this work!
Firewall Firewall Technical Architecture A A A A Remote Site A Citrix Access Gateway ProactiveWatchGateway VAR Explorer VAR Admin Console A Customer’s Other Windows or Unix Servers Web Servers HTTPS (443) Port Open Outbound Only Port Open Outbound Only (29443) Internet A ProactiveWatchGateway Port Open Outbound Only (29080) HTTPS (443) Port Open Outbound Only A Port Open Outbound Only (29443) A A A A Customer’s CitrixPresentationServer Farm ProactiveWatch Back-end Server Farm Customer Explorer(Optional) Internal Users
Installing The Software • Sign up for a free ProactiveWatch Account and free 30-day Evaluation • Download Agent, Gateway, and Explorer installers from Manage Web Site • Download the Explorer Admin and the Quick Start Guide • Follow the instructions in the Quick Start Guide to: • Select a Price Plan with the number of agents that you would like to try (you will not be charged during your 30 free evaluation period) • Set up licensing for each customer in the Allocate Licenses page of the Manage Site • Install a Gateway at each customer site • Install Agents with your VAR ID, and a unique Customer ID for that customer • Install the Explorer (Console) at your site
See Every Customer and Server On One Screen Monitors Alarms Customers Servers
The Monitors • Conn – Is the server communicating with our back end? • Lat – What is the latency for this server over the Internet? • C2S – What is the latency between any two sets of servers or workstations? • CPU – Is CPU usage to high, either in total, or by any single (rogue) process? • Mem – Is physical or virtual memory usage too high? • Disk – Are any of the disk volumes on the servers almost full? • Boot – Did the server reboot? • Apps – Have any applications been installed or uninstalled? • Prof – Did the system profile (IP address, etc.) change? • Reg – Did spyware or malware install itself in run or runonce in the registry? • Serv – Did a monitored service stop working? • Proc – Did a monitored process stop working? • Log – Did a monitored event log entry occur? • Port – Did a good Port disapear (1494), or did a “bad” Port appear (FTP)?
Detailed Alarm Diagnostics • Double-Click on any alarm in the main grid view to bring up Alarm History for that Server • Select an individual alarm to see: • Which processes and users are using the most CPU • Which processes and users are using the most memory • Which processes and users are generating the most disk activity
Easy To Use Citrix Capacity Analysis Resource Utilization and Concurrent User data collected every 10 seconds on each server CTX01 and CTX04 are identical hardware, have the same published applications, and are in a load balanced farm. CTX01 is running out of memory. CTX04 is not. Why?
Compare Installed Software Across Servers Select a set of rows in the Explorer, right-click and Application Compare Colored rows mean the software is installed. White means it is not CTX01 has Microsoft .Net 2.0, and a different set of hot fixes than CTX02
Compare Installed Software Across Servers Select a set of rows in the Explorer, right-click and Application Compare Selecting all of the servers in a farm highlights installation and version differences across the environment Provides you with the data you need to sell farm rebuild projects to your clients
Easily Analyze Event Log Patterns Select any row, right-click, choose Event Log Viewer System and Application Logs are automatically collected for all servers (other logs can be added) Log entries are sorted by Source and Severity Detail provides a hot link for a Google lookup of the Event ID
Reports and Notifications Notification Rules (SettingsNotification Rules) determine which alarms generatee email messages. Email can be filtered by alarm type and customer. Scheduled Reports (SettingsScheduled Reports) summarize the alarm activity for each customer every week. These reports are automatically generated every Monday morning and send via email to the selected addresses.
Monitoring Templates Monitoring Templates (SettingsMonitoring Templates) contain the settings and thresholds for all monitors. Four Templates are provided and used by default, and are read only. Clone them to create your own templates. To assign templates to a set of servers, select the rows in the Grid View of the Console, right click and select “Set Monitoring Template”. You can have one set of templates across all of your customers or customer specific templates.
Evaluation Program, Pricing, Billing, and Subscription Terms
Evaluation Program April, 15th – Registration Approved May, 15th – End of Evaluation June, 1st – First Invoice Sent July, 1st – Second Invoice Sent Full Month of Service 30 Day Free Evaluation 15 DayPro-Rated Billing Period 10 Servers $50 $100 20 Servers $100 $200
Price List • Price Plans – Bundles of Server Agents that can be assigned to any customer • VAR Consoles – Two concurrent VAR Consoles are included with every Price Plan. Additional ones may be purchased • Customer Consoles – If your customer had an on-site admin, you can sell your customer a Console that he can use to see his servers • Workstation Agents – Agents for end user workstations or PC’s. Sold separately from Price Plans of Server Agents
Accepted Forms of Payment • North America • Corporate Credit Card (will be charged on the 1st of every month) • EMEA, APAC • Corporate Credit Card (will be charged on the 1st of every month) • Bank Transfer in one of the accepted currencies transferred to ProactiveWatch Bank in USA
Subscription Terms • You will be charged on the 1st of each month for the maximum level of service that you have used in the preceding month • If you reduce the level of service in a month, you will still be charged for the maximum level of service in that month on the first of the next month, but the invoice after that will reflect the reduction • You can cancel your service at any time, and owe only the invoice for the upcoming month • We accept payment in US$, GBP, Euro, and Australian $ • The monthly fee includes support, all hot fixes, and upgrades to all future versions of ProactiveWatch • Support provided by email (support@proactivewatch.com).
Other Resources • Once you have your ProactiveWatch account, you can log onto the VAR Manage site • This site contains: • All of the software to download • All of the technical documentation • Sales materials you can use with customers and prospects • Any questions, please email sales@proactivewatch.com