Download
1 / 8
80 likes | 174 Views
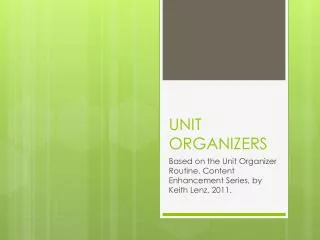
Unit Organizers feel free to expand, edit, or transform any of these for your own use. Algebra I-2 Course Map. Make sense of problems and persevere in solving them. Reason abstractly and quantitatively Construct viable arguments and critic the reasoning of others. Model with mathematics.

E N D
Unit Organizersfeel free to expand, edit, or transform any of these for your own use.
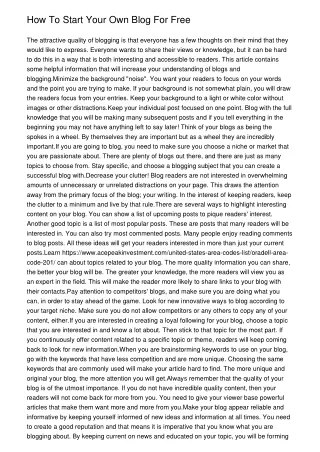
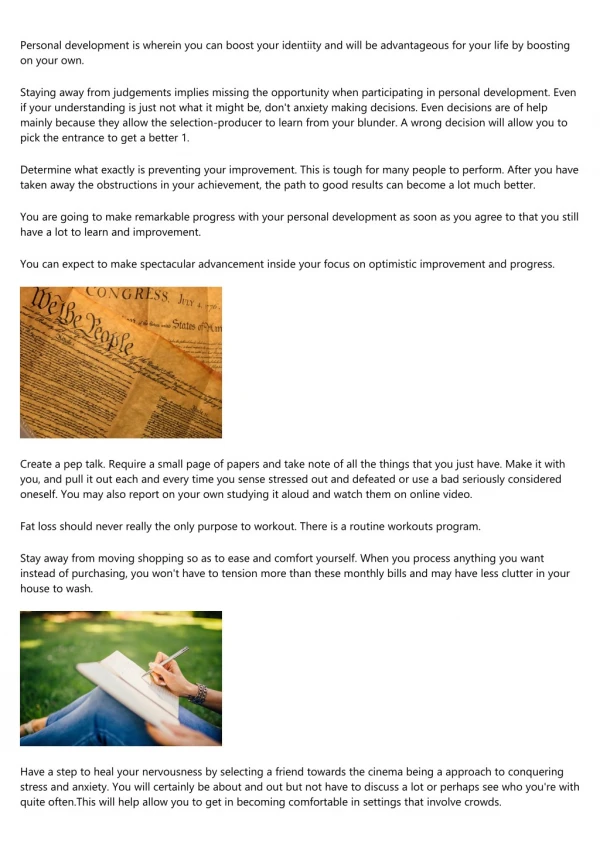
Algebra I-2 Course Map Make sense of problems and persevere in solving them. Reason abstractly and quantitatively Construct viable arguments and critic the reasoning of others. Model with mathematics. Use appropriate tools strategically. Attend to precision. Look for and make use of structure. Look for and express regularity in repeated reasoning. Mathematical Practices Descriptive Statistics Modeling Stats Data (suppl: 1 variable) Relationships between Quantities and Reasoning with Equations Modeling Stats Data (suppl: 2 variable) Create equations using multiple representations (chapter 2,3,4) Quadratic Functions and Modeling Critical Concepts Solving Linear Equations & Quadratics when x^2 cancels out (chapter 1-3 & 5) Graphing and Factoring Quadratic Equations (chapter 8 ) Expressions and Equations Solving Complex Proportions and Converting Units (chapter 5 & suppl: dimensional analysis) Solving Systems of equations (chapter 6) Linear and Exponential Relationships Representing Linear Relationships with graphs, tables,and equations (chapter 4 & 7) Representing Exponential Functions (Chapter 11 & Algebra 3-4 book: ch 2&3) Solving and graphing Inequalities and systems of inequalities (Chapter 9) Comparing Linear, Quadratic, and Exponential functions Simplifying and Solvng complex algebraic equations (chapter 10)
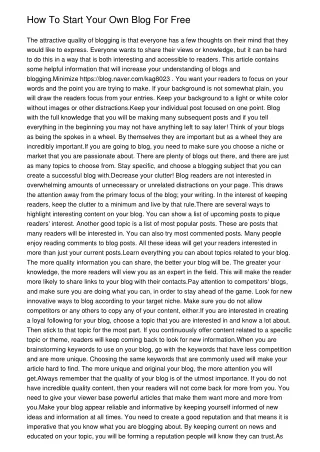
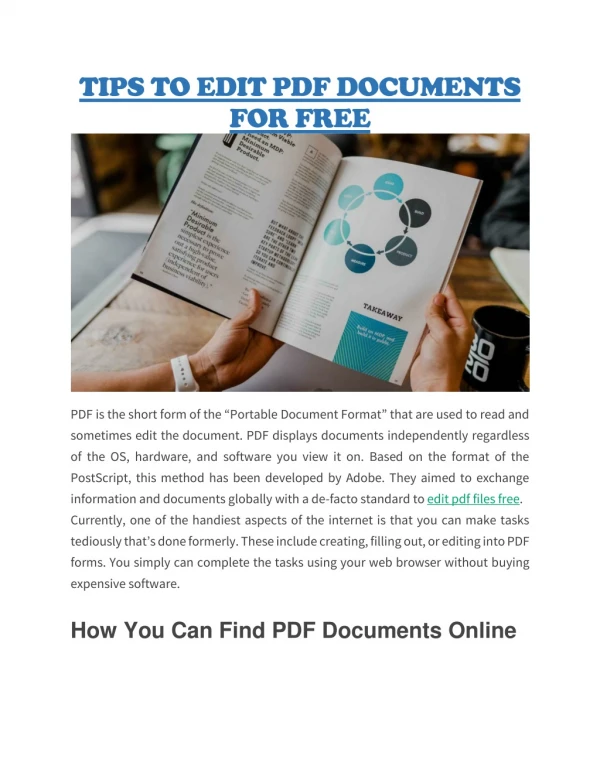
The Unit Organizer ALGEBRA 1-2 NEXT UNIT LAST UNIT CURRENT UNIT CURRENT UNIT none Representing Functions statistics: one variable Supplemental Activities is about... Graphical Representations: Histogram Box plot Line plot Interpreting the Shape Standard deviation Outlier Spread Center Data Distribution Summary statistics: Mean Median Mode Range Outlier Why would you want to use a histogram instead of line plot? What measure of center is most useful for categorical data and why? When would you use median instead of mode or mean to measure the center? How could you describe a data set? What tools would you use? What does the shape of the graph tell you about the data? Background knowledge UNIT SELF-TEST QUESTIONS
The Unit Organizer ALGEBRA 1-2 NEXT UNIT LAST UNIT CURRENT UNIT CURRENT UNIT Statistics Multiplication Representing Functions Supplemental Activities is about... Web: How they all relate Situation Table Graph Equation Table Graphs, Tables, and Equations Graph Coordinate pair Independent variable Dependent variable Origin x and y axis quadrants Equations Linear Exponential Quadratic m & b Background knowledge How do you identify growth in a table, graph, and an equation? How do you find the initial value (constant) in a table, graph, and an equation? How do you write an equation from a graph? A table? How do you make a table? UNIT SELF-TEST QUESTIONS
The Unit Organizer ALGEBRA 1-2 Multiplication: chapter 5 NEXT UNIT LAST UNIT CURRENT UNIT CURRENT UNIT Representing Functions Proportions Supplemental Activities is about... Area Sum & Area Product Algebra Tiles Generic Rectangles Slope Intercept Form Representing equations in different forms Standard Form Distributive Property Factors • How do use distribution to rewrite an expression? • How do you know when two terms have a common factor? • How do you find factors of an expression that has numbers and variables? • How do you solve multi-variable equation for one variable? Background knowledge UNIT SELF-TEST QUESTIONS
The Unit Organizer ALGEBRA 1-2 Proportions NEXT UNIT LAST UNIT CURRENT UNIT CURRENT UNIT Multiplication System of Equations Supplemental Activities Proportions in the Real World Unit Conversions is about... Solve for Variables using proportions Ratio Formats (colon, fraction, word) Direct Variation Similarity Solving proportions with expressions Cross multiplying What is direct variation? How do you convert units? How do you set up a proportion? How do you know when proportion is the proper method for solving a problem? Background knowledge UNIT SELF-TEST QUESTIONS
The Unit Organizer ALGEBRA 1-2 NEXT UNIT LAST UNIT CURRENT UNIT CURRENT UNIT Linear Relationships Proportions systems of equations: chapter 6 Supplemental Activities is about... Write an equation from a situation Define a Variable Identify initial value and slope No solution & All Numbers Parallel lines Coincide Solving for (x,y) Graphing intersect Elimination scalar multiplication Substitution Equal Values Check solution Background knowledge What does the solution of a system of equations represent? How can you tell when a system has no solution or infinite solutions? When would you want to use elimination instead of substitution? Why is it better to solve a system algebraically rather than graphically? How do you check a solution to a linear system? UNIT SELF-TEST QUESTIONS
The Unit Organizer ALGEBRA 1-2 NEXT UNIT LAST UNIT CURRENT UNIT CURRENT UNIT Statistics linear systems Linear Relationships: chapter 7 Supplemental Activities is about... Slope of Parallel and Perpendicular Lines Reciprocal opposite Slope Finding Slope Graph Equation Two Points Rates of Change Δy/ Δ x Positive Negative zero undefined Trend lines Prediction Finding an Equation Slope and a point Two points From a Graph From a table Background knowledge How to find the slope of a line given its equation its graph, or any two points on a line? How are slopes of parallel and perpendicular lines related? How do you find the slope of a line without graphing it? Name three considerations in deciding where to put a trend line? UNIT SELF-TEST QUESTIONS


![Space for collaborator logos or any other information [delete these instructions before use]](https://cdn4.slideserve.com/9087585/space-for-collaborator-logos-or-any-other-dt.jpg)