Download
1 / 7
70 likes | 194 Views
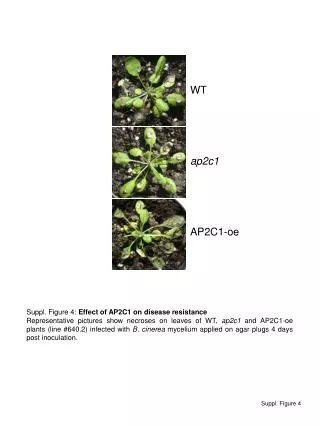
Suppl Figure S1. mMDH genes in At and t-DNA mutant characterization.

E N D
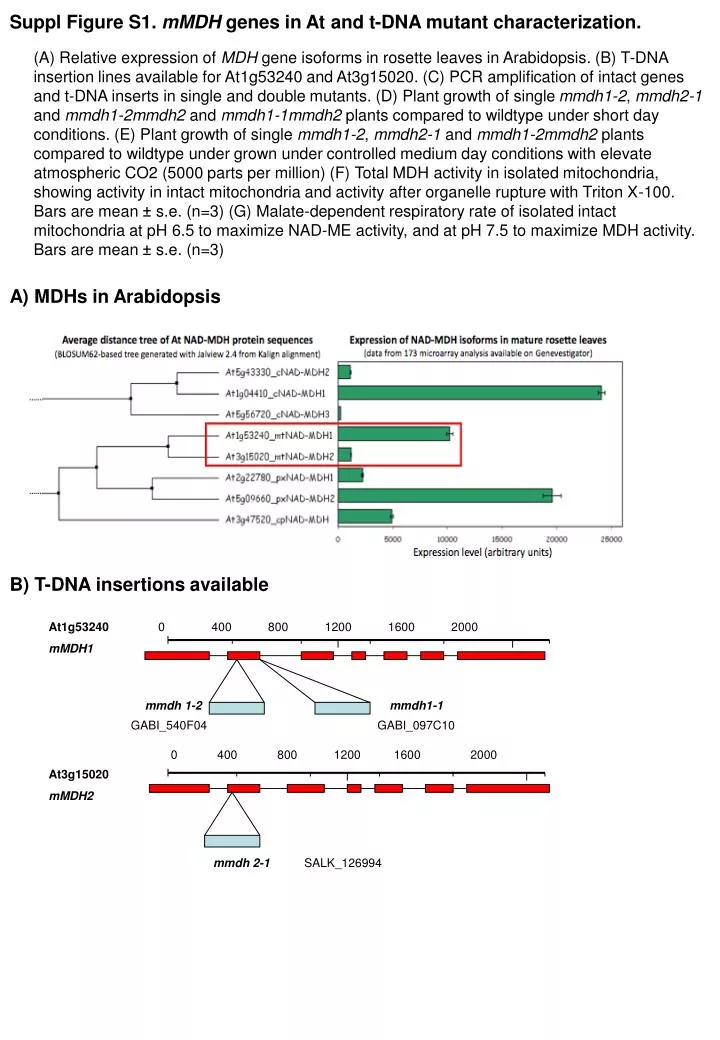
Suppl Figure S1. mMDH genes in At and t-DNA mutant characterization. (A) Relative expression of MDH gene isoforms in rosette leaves in Arabidopsis. (B) T-DNA insertion lines available for At1g53240 and At3g15020. (C) PCR amplification of intact genes and t-DNA inserts in single and double mutants. (D) Plant growth of single mmdh1-2, mmdh2-1 and mmdh1-2mmdh2 and mmdh1-1mmdh2 plants compared to wildtype under short day conditions. (E) Plant growth of single mmdh1-2, mmdh2-1 and mmdh1-2mmdh2 plants compared to wildtype under grown under controlled medium day conditions with elevate atmospheric CO2 (5000 parts per million) (F) Total MDH activity in isolated mitochondria, showing activity in intact mitochondria and activity after organelle rupture with Triton X-100. Bars are mean ± s.e. (n=3) (G)Malate-dependent respiratory rate of isolated intact mitochondria at pH 6.5 to maximize NAD-ME activity, and at pH 7.5 to maximize MDH activity. Bars are mean ± s.e. (n=3) A) MDHs in Arabidopsis At1g53240 mMDH1 0 400 800 1200 1600 2000 B) T-DNA insertions available mmdh 1-2 mmdh1-1 GABI_540F04 GABI_097C10 0 400 800 1200 1600 2000 At3g15020 mMDH2 mmdh 2-1 SALK_126994
C) PCR on DNA for insertions and wildtype MMDH genes in mutants mmdh1-1mmdh2 mmdh1-1 mmdh2-1 mmdh1-2mmdh2 WT mmdh1-2 mmdh2-1 WT Primer combination mMDH1-2 OR mMDH1-1 LB + RB Gabi LB + mMDH1-2 OR mMDH 1-1 RB mMDH2-1 LB + RB SALK Lba1 + mMDH2-1 RB D) Plant growth of mmdh knockout plants under short day conditions 40 days Wt mmdh1-2 mmdh2 mmdh1-2 mmdh2 mmdh1-1 mmdh2 E) Plant growth of mmdh knockout plants under medium day conditions in a high (5000ppm) CO2 atmosphere 42 days Wt mmdh1-2 mmdh2 mmdh1-2 mmdh2
(F) Total MDH activity in isolated mitochondria (G) Malate-dependent respiratory rate of isolated intact mitochondria
100 WT MS+ 80 60 WT MS- Germination Frequency (%) 40 mmdh1mmdh2 MS+ 20 mmdh1mmdh2 MS- 0 Day 0 Day 1 Day 2 Day 3 Day 4 Day 5 Day 6 Day 7 Suppl. Figure S2. Additional phenotypic characterization of mmdh mutants. (A) Germination assays of mutants (A) Germination rate of wildtype and mmdh1mmdh2 mutant seeds with or without MS media over a 7 day period. (B) Average seed production per plant in outside growth Wt, mmdh1-2, mmdh2-1 and mmdh1mmdh2 mutants. (C) Rosette size (diameter) and leaf number in 6 week old plants in Wt, mmdh1-2, mmdh2-1 and mmdh1mmdh2 mutants. (B) Seed production outside Genotype seeds per plant Wt 2087±213 (n=40) mmdh1-2 878±73 (n=40, p-value 1.278 e-07) mmdh2-1 1686±236 (n=40, p-value 0.2095)) mmdh1mmdh2 all plants died (n=30) (C) Rosette size and leaf number measurements at 6 weeks Rosette diameter (cm) Leaf number Wt mmdh1-2 mmdh2-1 mmdh1 mmdh2 Wt mmdh1-2 mmdh2-1 mmdh1 mmdh2
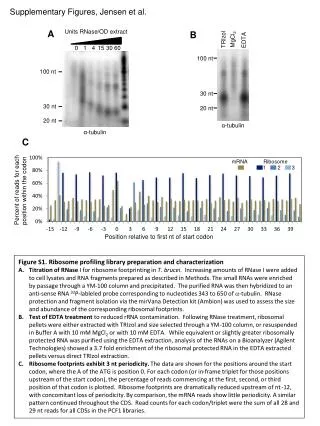
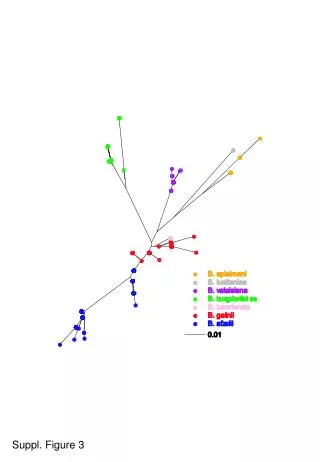
Suppl. Figure S3: Kinetics of CO2 evolution during the post-illumination period in mmdh mutants. Leaves were kept under photorespiratory conditions (PPFD = 1000 μmol.m-2.s-1; 100 ppm CO2) and were then shifted to the dark. The light was turned on again when a steady-state was reached. The transient peak measured in the first seconds of the dark period results from the decarboxylation of the large glycine pool built up under photorespiratory conditions, a phenomenon known as the post-illumination burst (PIB). After the peak, the rate of CO2 evolution increases slowly and reaches a steady-state after several minutes. The period of increased respiration is termed light-enhanced dark respiration (LEDR). The rate of CO2 evolution was recorded every two seconds. Three representative kinetics are shown for each genotype.
Suppl. Figure S4. A/Ci curves for mmdh mutants, light saturated CO2 assimilation rates and chlorophyll content index measurements. (A) Graphs showing the break in A/Ci curves for Wt, mmdh1-2, mmdh2, mmdh1mmdh2, and mmdh1mmdh2 35S:mMDH1 . (B) Light-saturated CO2 assimilation in wildtype compared to mmdh1-2, mmdh2 and mmdh1mmdh2, (C) chlorophyll content index in wildtype compared to mmdh1-2, mmdh2 and mmdh1mmdh2. A B C Wt Wt mmdh1 mmdh2 mmdh1 mmdh2 mmdh1-2 mmdh1-2 mmdh2 mmdh2
Supplemental Figure S5. PCR amplification of intact genes, t-DNA inserts and inserted mMDH1 cDNA in single and double mutants and the complemented mutant, used in Figure 7 and 8 experiments. mmdh1mmdh2 35S:mMDH1 mmdh1mmdh2 mmdh1-2 mmdh2-1 WT Primer combination a) mMDH1-2 LB + RB b) Gabi LB + mMDH1-2 RB c) mMDH2-1 LB + RB d) SALK Lba1 + mMDH2-1 RB e) mMDH1-2 full length genomic fragment 1.611 bp mMDH1cDNA 800 bp