Download
1 / 29
370 likes | 793 Views
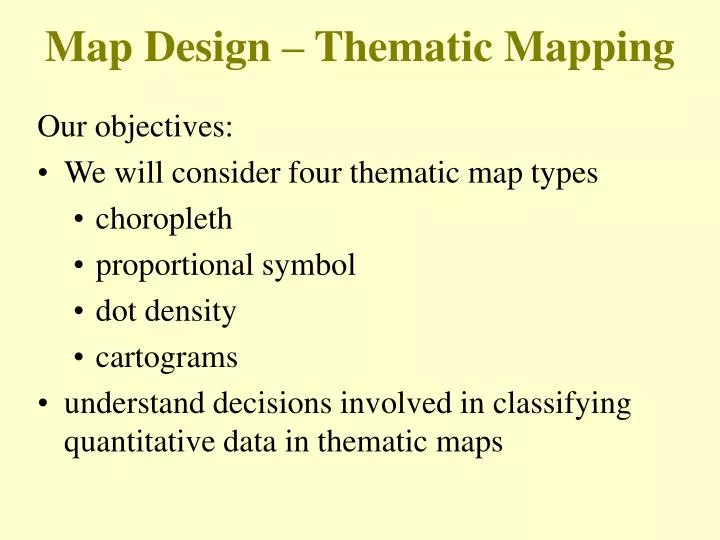
Map Design – Thematic Mapping. Our objectives: We will consider four thematic map types choropleth proportional symbol dot density cartograms understand decisions involved in classifying quantitative data in thematic maps. Choropleth Maps. Greek: choros (place) + plethos (filled).

E N D
Map Design – Thematic Mapping • Our objectives: • We will consider four thematic map types • choropleth • proportional symbol • dot density • cartograms • understand decisions involved in classifying quantitative data in thematic maps
Choropleth Maps • Greek: choros (place) + plethos (filled)
Choropleth Maps • These use polygonal enumeration units • - e.g. census tract, counties, watersheds, etc. • Data values are generally classified into ranges • Polygons can produce misleading impressions • - area/size of polygon vs. quantity of thematic data value
Thematic Mapping Issue:Modifiable Area Unit Problem • Assumption: • Mapped phenomena are uniformly spatially distributed within each polygon unit • This is usually not true! • Boundaries of enumeration units are frequently unrelated to the spatial distribution of the phenomena being mapped • This issue is always present when dealing with data collected or aggregated by polygon units
MAUP Modifiable Areal Unit Problem: (x represents the mean, below)Scale Effects (a,b)Zoning Effects (c,d) Note: the following numbers refer to quantities per unit area. a)b) c) d) Summary: As you “scale up” or choose different zoning boundaries, results change.
Classifying Thematic Data • Data values are classified into ranges for many thematic maps (especially choropleth) • This aids the reader’s interpretation of map • Trade-off: • presenting the underlying data accurately • VS. • generalizing data using classes • Goal is to meaningfully classify the data • group features with similar values • assign them the same symbol/color • But how to meaningfully classify the data?
Creating Classes • How many classes should we use? • too few - obscures patterns • too many - confuses map reader • difficult to recognize more than seven classes
Creating Classes Methods to create classes assign classes manually equal intervals: This ignores the data distribution “natural” breaks quartiles: top 25%, 25% above middle, 25% below middle, bottom 25% (quintiles uses 20%) standard deviation: mean+1s, mean-1s, mean+2s, mean-2s, …
The Effect of Classification Equal Interval Splits data into user-specified number of classes of equal width Each class has a different number of observations
The Effect of Classification Quantiles Data divided so that there are an equal number of observations are in each class Some classes can have quite narrow intervals
The Effect of Classification Natural Breaks Splits data into classes based on natural breaks represented in the data histogram
The Effect of Classification Standard Deviation Mean + or – Std. Deviation(s)
Natural Breaks Quantiles Equal Interval Standard Deviation
Thematic Mapping Issue:Counts Vs. Ratios When mapping count data, a problem frequently occurs where smaller enumeration units have lower counts than larger enumeration units simply because of their size. This masks the actual spatial distribution of the phenomena. Solution: map densities by area, e.g. population density, or generate other derived ratios, e.g. per capita income, automobile accidents per road mile
Thematic Mapping Issue:Counts Vs. Ratios • raw count (absolute) values may present a misleading picture • Solution: • normalize the data • ratio values
Proportional Symbol Maps • Size of symbol is proportional to size of datavalue • also called graduated symbol maps • Frequently used for mapping points’ attributes • avoids distortions due to area size as seen in choropleth maps
Dot Density Maps Map credits/source: Division of HIV/AIDS Prevention, National Center for HIV, STD, and TB Prevention (NCHSTP), Centers for Disease Control.
Dot Density Maps Population by county
Dot Density Maps • Dot density maps provide an immediate picture of density over area • 1 dot = some quantity of data value • e.g. 1 dot = 500 persons • the quantity is generally associated with polygon enumeration unit • MAUP still exists • Placement of dots within polygon enumeration units can be an issue, especially with sparse data
Cartograms • Instead of normalizing data within polygons: • We can change the polygons themselves! • Maps that do this are known as cartograms • Cartograms distort the size andshape of polygons to portray sizes proportional to some quantity other than physical area
Conventional Map of 2004 Election Results by State Michael Gastner, Cosma Shalizi, and Mark Newman- University of Michigan http://www-personal.umich.edu/~mejn/election/
Population Cartogram of 2004 Election Results by State Michael Gastner, Cosma Shalizi, and Mark Newman- University of Michigan http://www-personal.umich.edu/~mejn/election/
Electoral College Cartogram of 2004 Election Results by State Michael Gastner, Cosma Shalizi, and Mark Newman- University of Michigan http://www-personal.umich.edu/~mejn/election/
Conventional Map of 2004 Election Results by County Michael Gastner, Cosma Shalizi, and Mark Newman- University of Michigan http://www-personal.umich.edu/~mejn/election/
Population Cartogram of 2004 Election Results by County Michael Gastner, Cosma Shalizi, and Mark Newman- University of Michigan http://www-personal.umich.edu/~mejn/election/
Graduated Color Map of 2004 Election Results by County Robert J. Vanderbei – Princeton University http://www.princeton.edu/~rvdb/JAVA/election2004/
Graduated Color Population Cartogramof 2004 Election Results by County Robert J. Vanderbei – Princeton University http://www.princeton.edu/~rvdb/JAVA/election2004/