Download
1 / 1
10 likes | 127 Views
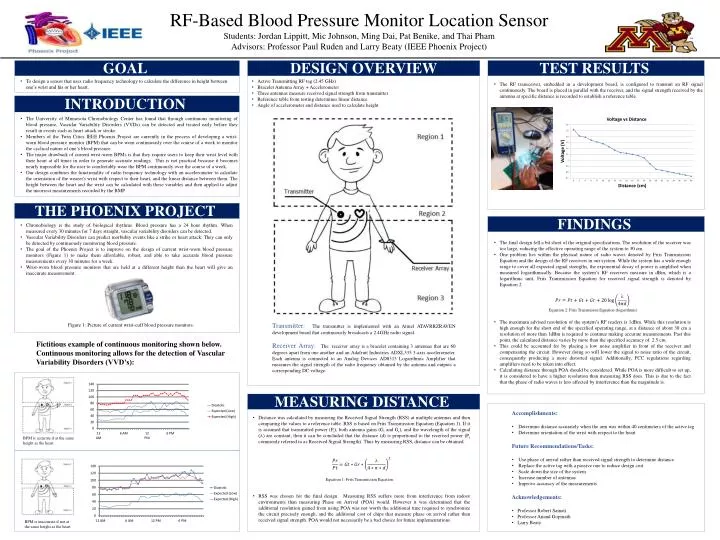
RF-Based Blood Pressure Monitor Location Sensor Students: Jordan Lippitt , Mic Johnson, Ming Dai, Pat Benike, and Thai Pham Advisors : Professor Paul Ruden and Larry Beaty (IEEE Phoenix Project). TEST RESULTS l. GOAL l. DESIGN OVERVIEW. Design Overview:

E N D
RF-Based Blood Pressure Monitor Location Sensor Students: Jordan Lippitt, Mic Johnson, Ming Dai, Pat Benike, and Thai Pham Advisors: Professor Paul Rudenand Larry Beaty(IEEE Phoenix Project) TEST RESULTSl GOALl DESIGN OVERVIEW • Design Overview: • Active Transmitting RF tag (2.45 GHz) • Bracelet Antenna Array + Accelerometer • Three antennas measure received signal strength from transmitter • Reference table from testing determines linear distance • Angle of accelerometer and distance used to calculate height • Experiment Setup/Results: • The RF transceiver, embedded in a development board, is configured to transmit an RF signal continuously. The board is placed in parallel with the receiver, and the signal strength received by the antenna at specific distance is recorded to establish a reference table. • To design a sensor that uses radio frequency technology to calculate the difference in height between one’s wrist and his or her heart. INTRODUCTIONl • The University of Minnesota Chronobiology Center has found that through continuous monitoring of blood pressure, Vascular Variability Disorders (VVDs) can be detected and treated early before they result in events such as heart attack or stroke. • Members of the Twin Cities IEEE Phoenix Project are currently in the process of developing a wrist-worn blood pressure monitor (BPM) that can be worn continuously over the course of a week to monitor the cyclical nature of one’s blood pressure. • The major drawback of current wrist-worn BPMs is that they require users to keep their wrist level with their heart at all times in order to generate accurate readings. This is not practical because it becomes nearly impossible for the user to comfortably wear the BPM continuously over the course of a week. • Our design combines the functionality of radio frequency technology with an accelerometer to calculate the orientation of the wearer's wrist with respect to their heart, and the linear distance between them. The height between the heart and the wrist can be calculated with these variables and then applied to adjust the incorrect measurements recorded by the BMP. THE PHOENIX PROJECTl FINDINGSl • Chronobiology is the study of biological rhythms. Blood pressure has a 24 hour rhythm. When measured every 30 minutes for 7 days straight, vascular variability disorders can be detected. • Vascular Variability Disorders can predict morbidity events like a strike or heart attack. They can only be detected by continuously monitoring blood pressure. • The goal of the Phoenix Project is to improve on the design of current wrist-worn blood pressure monitors (Figure 1) to make them affordable, robust, and able to take accurate blood pressure measurements every 30 minutes for a week. • Wrist-worn blood pressure monitors that are held at a different height than the heart will give an inaccurate measurement. • The final design fell a bit short of the original specifications. The resolution of the receiver was too large, reducing the effective operating range of the system to 30 cm. • One problem lies within the physical nature of radio waves denoted by Friis Transmission Equation and the design of the RF receivers in our system. While the system has a wide enough range to cover all expected signal strengths, the exponential decay of power is amplified when measured logarithmically. Because the system’s RF receivers measure in dBm, which is a logarithmic unit, Friis Transmission Equation for received signal strength is denoted by Equation 2. • Equation 2: Friis Transmision Equation (logarithmic) • The maximum advised resolution of the system’s RF readers is 1dBm. While this resolution is high enough for the short end of the specified operating range, at a distance of about 30 cm a resolution of more than 1dBm is required to continue making accurate measurements. Past this point, the calculated distance varies by more than the specified accuracy of 2.5 cm. • This could be accounted for by placing a low noise amplifier in front of the receiver and compensating the circuit. However doing so will lower the signal to noise ratio of the circuit, consequently producing a more distorted signal. Additionally, FCC regulations regarding amplifiers need to be taken into effect. • Calculating distance through POA should be considered. While POA is more difficult to set up, it is considered to have a higher resolution than measuring RSS does. This is due to the fact that the phase of radio waves is less affected by interference than the magnitude is. Transmitter: The transmitter is implemented with an Atmel ATAVRRZRAVEN development board that continuously broadcasts a 2.4GHz radio signal. Receiver Array: The receiver array is a bracelet containing 3 antennas that are 60 degrees apart from one another and an Adafruit Industries ADXL335 3-axis accelerometer. Each antenna is connected to an Analog Devices AD8313 Logarithmic Amplifier that measures the signal strength of the radio frequency obtained by the antenna and outputs a corresponding DC voltage. Figure 1: Picture of current wrist-cuff blood pressure monitors. Fictitious example of continuous monitoring shown below. Continuous monitoring allows for the detection of Vascular Variability Disorders (VVD’s): MEASURING DISTANCEl • Distance was calculated by measuring the Received Signal Strength (RSS) at multiple antennas and then comparing the values to a reference table. RSS is based on Friis Transmission Equation (Equation 1). If it is assumed that transmitted power (Pt), both antenna gains (Gt and Gr), and the wavelength of the signal () are constant, then it can be concluded that the distance (d) is proportional to the received power (Prcommonly referred to as Received Signal Strength). Thus by measuring RSS, distance can be obtained. • Equation 1: Friis Transmission Equation • RSS was chosen for the final design. Measuring RSS suffers more from interference from indoor environments than measuring Phase on Arrival (POA) would. However it was determined that the additional resolution gained from using POA was not worth the additional time required to synchronize the circuit precisely enough, and the additional cost of chips that measure phase on arrival rather than received signal strength. POA would not necessarily be a bad choice for future implementations. • Accomplishments: • Determine distance accurately when the arm was within 40 centimeters of the active tag • Determine orientation of the wrist with respect to the heart • Future Recommendations/Tasks: • Use phase of arrival rather than received signal strength to determine distance • Replace the active tag with a passive one to reduce design cost • Scale down the size of the system • Increase number of antennas • Improve accuracy of the measurements • Acknowledgements: • Professor Robert Sainati • Professor AnandGopinath • Larry Beaty BPM is accurate if at the same height as the heart BPM is inaccurate if not at the same height as the heart