Download
1 / 41
420 likes | 497 Views
Activity-Based Costing. Chapter 9. Edited by Dr . Charles Bailey for ACCT3310. Learning Objectives. LO 9-1 Understand the potential effects of using externally reported product costs for decision making. LO 9-2 Explain how a two-stage product costing system works.

E N D
Activity-Based Costing Chapter 9 Edited by Dr. Charles Bailey for ACCT3310
Learning Objectives LO 9-1Understand the potential effects of using externally reported product costs for decision making. LO 9-2Explain how a two-stage product costing system works. LO 9-3Compare and contrast plantwide and department allocation methods. LO 9-4 Explain how activity-based costing and a two-stage product system are related. LO 9-5 Compute product costs using activity-based costing. LO 9-6 Compare activity-based product costing to traditional department product costing methods. LO 9-7 Demonstrate the flow of costs through accounts using activity-based costing. LO 9-8 Apply activity-based costing to marketing and administrative services.
LO 9-1 Product Costs and Decision Making LO 9-1 Understand the potential effects of using externally reported product costs for decision making. C-27s C-20s Total Units produced Direct labor-hours Costs: Direct materials Direct labor Manufacturing overhead (@ 120% of DL) Total Cost per unit 10 2,000 $ 40,000 72,000 86,400 $198,400 $ 19,840 30 3,000 $ 36,000 78,000 93,600 $207,600 $ 6,920 40 5,000 $ 76,000 150,000 180,000 $406,000 Grange is considering dropping C-27s.
LO 9-1 Product Costs and Decision Making The accountant estimated that overhead will be $163,800. Original C-20s only • Manufacturing overhead: • Utilities • Supplies • Training • Supervision • Machine depreciation • Plant depreciation • Miscellaneous • Total overhead $ 2,400 2,500 30,000 54,900 29,550 40,050 20,600 $180,000 $ 1,800 1,300 15,600 54,900 29,550 40,050 20,600 $163,800
LO 9-1 Product Costs and Decision Making Original C-20s only Direct materials Direct labor Manufacturing overhead Total costs $ 76,000 150,000 180,000 $406,000 $ 36,000 78,000 163,800 $277,800 The cost per unit for the C-20s will increase from $6,920 to $9,260.
LO 9-1 The Death Spiral This is a process that begins by attempting to increase price to meet reported product cost. This may result in demand for even fewer units.
LO 9-2 Two-Stage Cost Allocation LO 9-2 Explain how a two-stage product costing system works. First stage: Allocate overhead costs to departments. Second stage: Allocate department overhead costs to the products or services.
LO 9-2 Two-Stage Cost Allocation Cost pool Overhead Intermediate cost pools Department A Department B Cost allocation rule Direct labor hours Machine hours
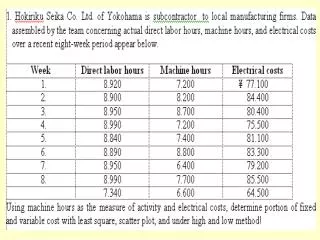
LO 9-2 Two-Stage Cost Allocation Third Quarter – Production and Cost Data J25P J40X Total Number of units Machine hours – Assembly Direct materials Direct labor – Assembly Direct labor – Packaging Total direct labor Total direct cost Overhead costs: Assembly Packaging Total overhead Total costs 100,000 6,000 $1,500,000 $ 750,000 990,000 $1,740,000 $3,240,000 40,000 30,000 $2,400,000 $ 600,000 360,000 $ 960,000 $3,360,000 140,000 36,000 $3,900,000 $1,350,000 1,350,000 $2,700,000 $6,600,000 $1,620,000 810,000 $2,430,000 $9,030,000 The cost system allocates manufacturing overhead to products based on direct labor costs.
LO 9-2 Two-Stage Cost Allocation Third Quarter – Unit Cost Report – One allocation rate J25P J40X Units produced Direct material Direct labor: Assembly Packaging Total direct labor Direct cost Applied overhead (@ 90% of direct labor costs) 100,000 $ 15.00 $ 7.50 9.90 $ 17.40 $ 32.40 15.66 $ 48.06 40,000 $ 60.00 $ 15.00 9.00 $ 24.00 $ 84.00 21.60 $105.60
LO 9-2 Two-Stage Cost Allocation Third Quarter – Unit Cost Report –Two Stage Allocation J25P J40X Units produced Direct material Direct labor: Assembly Packaging Total direct labor Direct cost Applied overhead: Assembly @ $45/machine hour Packaging @ 60% of direct labor cost Total overhead Unit costs 100,000 $ 15.00 $ 7.50 9.90 $ 17.40 $ 32.40 $ 2.70 5.94 $ 8.64 $ 41.04 40,000 $ 60.00 $ 15.00 9.00 $ 24.00 $ 84.00 $ 33.75 5.40 $ 39.15 $123.15 Vs. $48.06 $105.60
LO 9-3 Plantwide versusDepartment-Specific Rates LO 9-3 Compare and contrast plantwide and department allocation methods. Plantwide allocation method All overhead costs are recorded in one cost pool and applied to products using one overhead allocation rate. One cost pool for each department
LO 9-3 Plantwide versusDepartment-Specific Rates Department allocation method Overhead costs are traced to separate departments and applied to products using a department allocation rate. One cost pool for each department
LO 9-3 Choice of Allocation Methods Which cost application method is appropriate? Similar products using same resources Plantwide allocation Multiple products using resources differently Department allocation
LO 9-4 Activity-Based Costing (ABC) LO 9-4 Explain how activity-based costing and a two-stage product system are related. ABC is a costing method that first assigns costs to activities and then assigns them to products based on the products’ consumption of activities. Stage 1: Assign costs to activities. Stage 2: Assign costs to products based on the use of each activity
LO 9-4 Activity-Based Costing (ABC) Why ABC? Products (or services) consume activities Activities consume resources
LO 9-4 Developing Activity-Based Costs Step 1: Identify the activities that consume resources and assign costs to them. Step 2: Identify the cost driver(s) associated with each activity. Step 3: Compute a cost rate per cost driver unit or transaction. Step 4: Assign costs to products by multiplying the cost driver rate by the volume of cost driver units consumed by the product.
Activity-Based Costing System Fundamental Cost Objects: Labor, materials, etc. (All indirect to the Product or Service) Cost drivers Cost of Activity A Cost of Activity B, etc. Other Indirect Costs of product/svc (including other non-ABC items) Activity drivers Other Cost drivers Cost of Product, Service, Customer Direct Costs Traced
LO 9-4 Cost Drivers Cost drivers are factors that cause or “drive” an activity’s costs. Identified Activity Identified Cost Driver Setting up machines Handling material Machining Packaging and shipping ?
LO 9-4 Cost Hierarchies This is the classification of cost drivers into general levels of activity; volume, batch, product, and so on. Hierarchy Level Cost Example Cost Driver Example
LO 9-4 Cost Hierarchies This is the classification of cost drivers into general levels of activity; volume, batch, product, and so on. Hierarchy Level Cost Example Cost Driver Example Volume related Supplies Lubricating oil Machine repair Direct labor costs Machine hours Number of units
LO 9-4 Cost Hierarchies This is the classification of cost drivers into general levels of activity; volume, batch, product, and so on. Hierarchy Level Cost Example Cost Driver Example Volume related Supplies Lubricating oil Machine repair Direct labor cost Machine-hours Number of units Batch related Setup costs Material handling Shipping costs Setup hours Production runs Number of shipments
LO 9-4 Cost Hierarchies This is the classification of cost drivers into general levels of activity; volume, batch, product, and so on. Hierarchy Level Cost Example Cost Driver Example Volume related Supplies Lubricating oil Machine repair Direct labor cost Machine-hours Number of units Batch related Setup costs Material handling Shipping costs Setup hours Production runs Number of shipments Product related Compliance costs Design and specification costs Number of products
LO 9-4 Cost Hierarchies The cost hierarchy in any ABC system depends on the cost category and its cost driver. Hierarchy Level Cost Example Cost Driver Example Volume related Supplies Lubricating oil Machine repair Direct labor cost Machine-hours Number of units Batch related Setup costs Material handling Shipping costs Setup hours Production runs Number of shipments Product related Compliance costs Design and specification costs Number of products Facility related General plant costs Plant admin. costs Staying in business!
LO 9-5 Activity-Based Costing Illustrated Third Quarter – Production and Cost Data LO 9-5 Compute product costs using activity-based costing. J25P J40X Total Number of units Machine hours – Assembly Direct materials Direct labor – Assembly Direct labor – Packaging Total direct labor Total direct cost Overhead costs: Assembly Packaging Total overhead Total costs 100,000 6,000 $1,500,000 $ 750,000 990,000 $1,740,000 $3,240,000 40,000 30,000 $2,400,000 $ 600,000 360,000 $ 960,000 $3,360,000 140,000 36,000 $3,900,000 $1,350,000 1,350,000 $2,700,000 $6,600,000 $1,620,000 810,000 $2,430,000 $9,030,000
LO 9-5 Activity-Based Costing IllustratedStep 1: Identify the Activities Assembly Department Packaging Department Setting up machines Handling material Product assembly Inspection Packing Shipping
LO 9-5 Activity-Based Costing IllustratedStep 2: Identify the Cost Drivers Cost Driver Volume Activity Cost Driver J25P J40X Total Assembly building: Assembling Setting up machines Handling material Packaging building: Inspecting and packing Shipping Machine-hours Setup hours Production runs Direct labor hours No. of shipments 6,000 40 8 60,000 100 30,000 400 40 22,800 200 36,000 440 48 82,800 300
LO 9-5 Activity-Based Costing IllustratedStep 3: Compute the Cost Driver Rates Overhead Cost Building and Activity Cost Driver Volume Cost Driver Rate Assembly building: Assembling Setting up machines Handling material Total assembly overhead Packaging building: Inspecting and packing Shipping Total packaging overhead Total overhead $1,080,000 396,000 144,000 $1,620,000 $ 414,000 396,000 $ 810,000 $2,430,000 ÷ 36,000 machine hour = ÷ 440 hours = ÷ 48 runs = ÷82,800 direct labor hr = ÷ 300 shipments = $ 30/machine hour $ 900/setup hour $ 3,000/run $ 5/direct labor hour $ 1,320/shipment
LO 9-5 Activity-Based Costing IllustratedStep 4: Assign Costs Using ABC Overhead J25P J40X Assembly building: Assembling @ $30/machine hour Machine setup @ $900/setup hour Handling material @ $3,000/run Packaging building: Inspection and packaging @ $5/direct labor hour Shipping @ $1,320/ shipment Total ABC overhead $180,000 36,000 24,000 300,000 132,000 $672,000 $ 900,000 360,000 120,000 114,000 264,000 $1,758,000
LO 9-5 Cost Flow Diagram – ABC System Direct costs Manufacturing overhead Directly assigned Assembly building Packaging building Assembling Setup Handling material Inspecting/ packaging Shipping Machine hours Setup hours Runs Direct LH Ship- ments J25P J40X
LO 9-5 Activity Based Costing – Illustrated J25P J40X Direct material Direct labor: Assembly Packaging Total direct labor Direct costs Overhead: Assembly building: Assembling @ $30 per machine hour Machine setup @ $900 per setup hour Handling material @ $3,000 per run Package building: Inspecting and packing @ $5 per direct labor hour Shipping @ $1,320 per shipment Total ABC overhead Total ABC cost Number of units Unit cost $1,500,000 $ 750,000 990,000 $1,740,000 $3,240,000 $ 180,000 36,000 24,000 300,000 132,000 $ 672,000 $3,912,000 100,000 $ 39.12 $2,400,000 $ 600,000 360,000 $ 960,000 $3,360,000 $ 900,000 360,000 120,000 114,000 264,000 $1,758,000 $5,118,000 40,000 $ 127.95
LO 9-6 Unit Costs Compared LO 9-6 Compare activity-based product costing to traditional department product costing methods. Comparison of Reported Unit Product Costs J25P J40X Plantwide rate Department (building) rate Activity-based costing $48.06 $41.04 $39.12 $105.60 $123.15 $127.95
LO 9-7 Cost Flows through Accounts LO 9-7 Demonstrate the flow of costs through accounts using activity-based costing. Let’s see ABC cost flow for the Assembly Department. It's T-account time!
LO 9-7 Direct Materials Costs Assembly WIP J25P Materials Inventory DM 1,500,000 1,500,000 2,400,000 Assembly WIP J40X DM 2,400,000
LO 9-7 Direct Labor Costs Assembly WIP J25P Wages Payable DM 1,500,000 750,000 DL 750,000 600,000 Assembly WIP J40X DM 2,400,000 DL 600,000
LO 9-7 Overhead Costs Assembling Assembly WIP J25P DM 1,500,000 1,080,000 180,000 DL 750,000 900,000 OH 240,000 Setting Up 396,000 36,000 Assembly WIP J40X 360,000 DM 2,400,000 Handling Material DL 600,000 144,000 24,000 OH1,380,000 120,000
LO 9-7 Transfer from Assembly to Packaging Assembly WIP J25P Packaging WIP J25P 2,490,000 DM 1,500,000 2,490,000 DL 750,000 OH 240,000 Assembly WIP J40X Packaging WIP J40X 4,380,000 DM 2,400,000 4,380,000 DL 600,000 OH1,380,000
LO 9-8 ABC Costing in Administration LO 9-8 Apply activity-based costing to marketing and administrative services. The same four-step process: Step 1: Identify the activities that consume resources. Step 2: Identify the cost driver associated with each activity. Step 3: Compute a cost rate per cost driver for each unit or transaction. Step 4: Assign costs to the marketing or administration activity by multiplying the cost driver rate by the volume of cost driver units consumed for that activity.
Major Differences,Traditional Costing vs. ABC Typical SystemABC One or a few indirect Many pools cost pools Application base may Base more likely a be a true cost driver true cost driver Application base often Bases likely to be financial (direct labor cost, non-financial (# of parts, direct material cost, etc) number of operations, hours of testing, etc.)
Decision Usefulness of Cost Hierarchies • Different levels of cost drivers: Level_______Useful for Decisions Such As… Output-unit Shall we increase production, and at what price? Batch How often should we produce batches? What base amount must we charge to set up a “run,” regardless of the number of units made? Product/Service-Related Should we continue to offer this service/product? Facility-Related Shall we continue in business or dissolve it?