Download
1 / 34
340 likes | 418 Views
Mark A. Chandler NASA Goddard Institute for Space Studies at Columbia University. Global Climate Simulations Windows on the World of Tomorrow. Renewable Energy Summit, Milwaukee, Wisconsin, March 13, 2008. Changes In Greenhouse Gases from Ice Core and Modern Data. N 2 O. CO 2. CH 4.

E N D
Mark A. Chandler NASA Goddard Institute for Space Studies at Columbia University Global Climate SimulationsWindows on the World of Tomorrow Renewable Energy Summit, Milwaukee, Wisconsin, March 13, 2008
Changes In Greenhouse Gases from Ice Core and Modern Data N2O CO2 CH4 Fig. TS.2, IPCC 2007
Trend Length Years 25 50 100 150 Global Temperature Trends 1850-2005 Surface and TroposphereTrend Maps (1979-2005) Temperature retrievals from satellites now generally consistent with surface-based observations (except for the tropics) -0.75 0.75 °C per decade
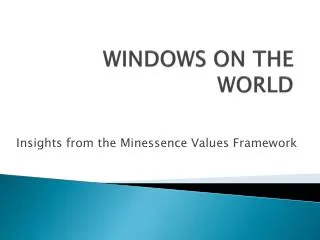
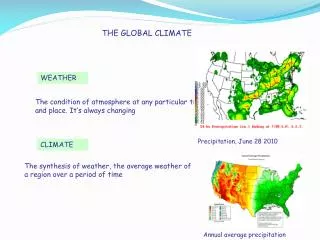
What are Global Climate Models and what do they project about the future?
Increased Resolution RequiresIncreased Computing Power Increased Grid ResolutionRequires Increased Computing Power Rule of thumb: 10X more CPU for a doubling of resolution Circa 1980’s Circa 2000’s
Fundamental Physical Quantities • At every grid cell GCMs calculate: • Temperature (T) • Pressure (P) • Winds (U, V) • Humidity (Q)
GCM Fundamental Physical Equations T, P, U, V, and Q calculated and related to each other via:
Physical Processes Simulated by GCMs • Seasonal and Diurnal Cycles • Latent and Sensible Heat Fluxes • Clouds and Convection • Planetary Boundary Layer • Greenhouse Gases • Aerosols • Sea Ice • Ground Hydrology • Ocean Heat Transport • Ocean Circulation • Dynamic Vegetation • Dynamic Ice Sheets • Carbon Cycle Chemistry
So, What Is a GCM Really?A Computer Program Global_Warming_Sim2.R Model II 8/24/2000Owner: Dr. Mark Chandler, chandler@giss.nasa.govGroup: Paleoclimate GroupThis experiment simulates climate change based on a1 percent/year increase in CO2Object modules:MainC9 DiagC9 RadC9FFTC9UTILC9Data input files:7=G8X10_600Ma9=NOV1910.rsf_snowball15=O8X10_600Ma19=CD8X10_600Ma23=V8X10_600Ma26=Z8X101_600Ma21=RTAU.G25L1522=RPLK2529=Snowball_Earth_RegionsLabel and Namelist:Global_Warming_Sim2 (Transient increase in CO2) &INPUTZ TAUI=10176.,IYEAR=1900, KOCEAN=1, SRCOR=.95485638151, S0X=1.,CO2=.31746031746031, USET=0.,TAUE=35040., USESLP=-12., ISTART=3,KCOPY=2,NDPRNT=-1,TAUE=10177.,TAUP=95616., C** INITIALIZE SOME ARRAYS AT THE BEGINNING OF SPECIFIED DAYS fName = './prt/'//JMNTH0(1:3)//CYEAR//'.prt'//LABEL1( IF(JDAY.NE.32) GO TO 294 JEQ=1+JM/2 DO 292 J=JEQ,JM DO 292 I=1,IM 292 TSFREZ(I,J,1)=JDAY JEQM1=JEQ-1 DO 293 J=1,JEQM1 DO 293 I=1,IM 293 TSFREZ(I,J,2)=JDAY GO TO 296 294 IF(JDAY.NE.213) GO TO 296 JEQM1=JM/2 DO 295 J=1,JEQM1 DO 295 I=1,IM 295 TSFREZ(I,J,1)=JDAY C**** INITIALIZE SOME ARRAYS AT THE BEGINNING OF EACH DAY 296 DO 297 J=1,JM DO 297 I=1,IM TDIURN(I,J,1)=1000. TDIURN(I,J,2)=-1000. TDIURN(I,J,6)=-1000. PEARTH=FDATA(I,J,2)*(1.-FDATA(I,J,3)) IF(PEARTH.GT.0.) GO TO 297 TSFREZ(I,J,1)=365. TSFREZ(I,J,2)=365. 297 CONTINUE GCMs Require High-Level Programming Skillsand Supercomputing Resources Unix Scripts Fortran Code
Simulation Distribution Simulation Results Collection Scientific Community GSFC GISS Langley Distributed Computing Climate Experiments “Big Iron” Computing Personal Computers School Labs University Clusters DOE NASA NSF EdGCM Model E EdGCM Model E EdGCM Model E GISS Model E GISS Model E GISS Model E Desktop Client Computing Resources National Lab Supercomputing Resources Primary Server Perturbed Physics Ensembles NASA MAP Climate Scientists
Climate Computing @ Home and School Scarsdale Teachers Institute Workshop, March 3 and 4, 2006
IPCC Special Report on Emissions Scenarios (SRES) What are the model inputs and where do they come from? • Population Prospects • Economic Development • Energy Demand • Resource Availability • Technological Change • Future Energy Systems • Land Use • Environmental Policy Google: IPCC SRES
Figure SRES 5-1 An Example of the Greenhouse Gas Emissions Scenarios Carbon Dioxide Scenarios
Figure SPM-6 IPCC 2007 Atm-Ocn GCM Projections of Surface Air Temperatures IPCC 2007 Atm-Ocn GCM Projections of Surface Air Temperatures 0.0 8.0 °C
Continental Temperature Anomalies: Observations and Projections Fig. TS.29
Model Ensemble Changes in Temperature, Precip, Storminess IPCC, WG1, 2007
The Last Global Warming vs. The Coming Global Warming Mid-Pliocene
Pliocene Sea Surface Temperature Anomaly(January) ∆T = +2.09°C
Simulated Change in Surface Air Temperature(Annual Average) ∆T = +2.1°C
3 Mya 2005
Pliocene Temperature Change: 3 MYA +2.13 °C 2050s +2.33 °C
The Last Global Warming vs. The Coming Global Warming Pliocene DATA IPCC AOGCM The North AtlanticConundrum
Impacts at ∆ Global Mean Temperature(R. Warren, in “Avoiding Dangerous Climate Change” 2006) • 1°C: world ocean and arctic ecosystems damaged • 1.5°C: Greenland ice sheet melting starts; ecosystems damaged in many regions • 2°C: Agricultural yields fall, 1-3 billion experience water stress, sea level rise displaces millions, malaria risks spread, Arctic ecosystems collapse, extinctions soar, 97% of coral reefs gone, global ecosystems lose 5-66% of their extent; • 2-3°C: Amazon and other forests and grasslands collapse, adding to CO2 increase • 3°C: Millions at risk to water stress, flood, hunger, dengue and malaria increase, few ecosystems can adapt, losing 7-74% of extent • 4°C: whole regions forced out of agriculture (Australia), thermohaline circulation could collapse, West Antarctic Ice Sheet melting may begin, increases in extreme weather, 60% loss of tundra
21st Century Global Warming Climate Simulations for IPCC 2007 Report ► Climate Model Sensitivity 2.0-5.0ºC for 2xCO2 (consistent with paleoclimate data & other models) ► Simulations Consistent with 1880-2003 Observations Source: Hansen et al., to be submitted to J. Geophys. Res.
IPCC MAIN FINDINGS • Working Group I – The climate is warming and humans are causing it. (90% Certainty) • Working Group II – Impacts are occurring now as a consequence of human-caused climate change. Specific future impacts have been identified. A portfolio of adaptation and mitigation measures can diminish the risks associated with climate change. • Working Group III – There is substantial potential for mitigation. Projected costs are ~3% of global GDP in 2030. All sectors, as well as changes in lifestyle and behavior patterns, can contribute to climate change mitigation.
Pliocene Global Warming: Main Findings • Global warming was 2-3°C higher than modern, similar to projected temperatures in the latter half of the 21st century. • Sea level was approximately 25 meters higher than today, indicating probably complete loss (collapse?) of Greenland and West Antarctic ice sheets. • North Atlantic ocean was a key area of warming in past global warming scenarios in contrast to the IPCCC AOGCM estimates of future climate change. If model’s are underestimating the climate change impact in the N. Atlantic global warming could proceed more rapidly than our current projections.