Download
1 / 39
390 likes | 472 Views
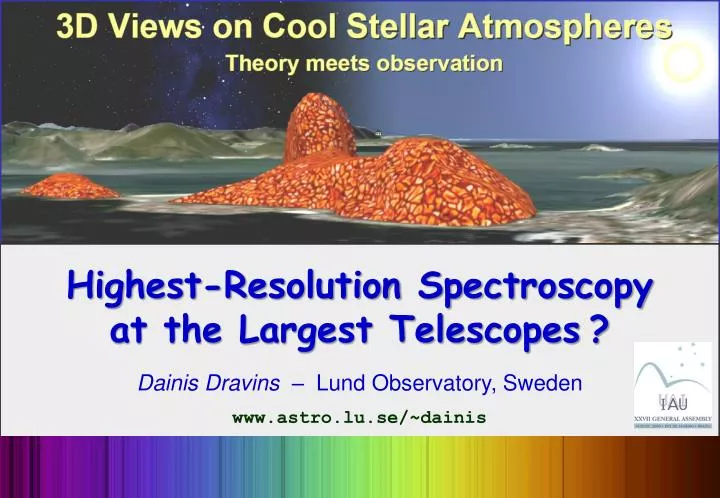
Highest-Resolution Spectroscopy at the Largest Telescopes ? Dainis Dravins – Lund Observatory , Sweden www.astro.lu.se /~ dainis. But why ? Changing paradigms…. Stellar atmosphere theory classics… Unsöld (1938, 1968); Mihalas (1969, 1978). CHANGING STELLAR PARADIGMS.

E N D
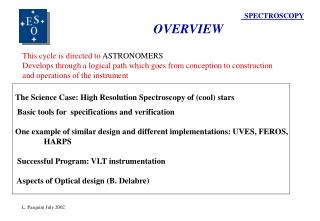
Highest-Resolution Spectroscopy at the Largest Telescopes? Dainis Dravins– Lund Observatory, Sweden www.astro.lu.se/~dainis
But why? Changing paradigms…
Stellar atmosphere theory classics… Unsöld (1938, 1968); Mihalas (1969, 1978)
CHANGING STELLAR PARADIGMS • PAST: ”Inversion” of line profiles; “any part of a profile corresponds to some height of formation” • NOW: Stellar line profiles reflect distribution of lateral inhomogeneities across stellar surfaces • Not possible,not even in principle, to ”invert” observed profiles into atmospheric parameters • Confrontation with theory through ”forward modeling”– computations versus observables
Spatially resolved line profiles of the Fe I 608.27 nm line in a 3-D solar simulation. Thick red line is the spatially averaged profile. Steeper temperature gradients in upflows tend to make their blue-shifted lines stronger M.Asplund: New Light on Stellar Abundance Analyses: Departures from LTE and Homogeneity, Ann.Rev.Astron.Astrophys. 43, 481
“ULTIMATE” INFORMATION CONTENT OF STELLAR SPECTRA ? 3-D models predict detailed line shapes and shifts … but … their predictions may not be verifiable due to: • Absence of relevant stellar lines • Blends with stellar or telluric lines • Uncertain laboratory wavelengths • Data noisy, low resolution, poor wavelengths • Line-broadening: rotation, oscillations
Limits of ‘unblended’ lines? Individual bisectors (red), overplotted on line profiles, for Fe II lines in UVES Paranal spectra of 68 Eri (F2 V), θ Scl (F5 V), and ν Phe (F9 V). Bisector scale (top) is expanded a factor of 10. Dravins, A&A 492, 199 (2008)
Limits to line statistics? Fe II bisectors at solar disk center, and of integrated sunlight, on an absolute wavelength scale. Thin curves are individual bisectors; thick dashed is their average. Dravins, A&A 492, 199 (2008)
Limits to spectral fidelity? Different line profiles in different recordings of solar spectra. Solar disk center (Jungfraujoch & Hamburg); Integrated sunlight (Kitt Peak); Moonlight (UVES).Dravins, A&A 492, 199 (2008)
Theoretical bisectors in K-type dwarfs, “observed” at R=160,000 & R=200,000 Theoretical bisectors of 522.84 nm Fe I line for V sin i = 0 and 2 km/s, at R= infinite, R = 210,000, and R = 160,000 I.Ramírez, C. Allende Prieto, L. Koesterke, D. L. Lambert, M. Asplund Granulation in K-type dwarf stars. II. Hydrodynamic simulations and 3D spectrum synthesis Astron. Astrophys. 501, 1087 (2009)
Fe I-line bisectors in Sun and Procyon (F5 IV-V) Bisectors for Fe I lines of different strength, produced from a time-dependent 3-D model C.AllendePrieto, M.Asplund, R.J.García López, D.L.Lambert: Signatures of Convection in the Spectrum of Procyon: Fundamental Parameters and Iron Abundance, Astrophys.J. 567, 544
Limits to spectral resolution? Fe II bisectors in Procyon, measured with successively higher spectral resolution. Left: R = 80,000; Middle: R = 160,000; Right: R = 200,000. Dravins, A&A 492, 199 (2008)
MODELING SPECTRA (not only single lines) LTE solar 3-D spectra, assuming [O]=8.86 for two different van der Waals damping constant (black lines). Blue line: observed disk center FTS spectrum by Neckel (“Hamburg photosphere”), slightly blueshifted. Hans-GünterLudwig
O I LINE PROFILES & SHIFTS 777.41 O I 777.19 777.53 LTE solar 3-D hydrodynamic spectra, assuming [O]=8.86, for two different damping constants (black lines). Blue line: observed disk-center FTS spectrum, slightly blueshifted. Hans-Günter Ludwig
Limitsfromwavelengthnoise? Ti II bisectors at solar disk center from the Jungfraujoch grating spectrometer, and as recorded with the Kitt Peak FTS . Bisectors have similar shapes but differ in average lineshift, and scatter about their average. Dravins, A&A492, 199 (2008)
Potsdam Echelle Polarimetric and Spectroscopic Instrument @ Large Binocular Telescope
2080 cm R4 echelle grating for PEPSI
Optical arrangement of multi-camera CODEX design Pasquini et al.: CODEX: the high resolution visual spectrograph for the E-ELT Proc. SPIE 7014, 70141I (2008)
Resolving power and spectral range of proposed 42-m E-ELT spectrographs
Beyond CODEX: Spatially resolved stellar spectroscopy VLT image of Betelgeuse in near-IR Kervellaet al.: The close circumstellar environment of Betelgeuse. Adaptive optics spectro-imaging in the near-IR with VLT/NACO A&A, in press (2009)
Corrugated stellar surfaces?
Simulated intensities approaching the solar limb Mats Carlsson, Oslo; in Å.Nordlund, R.F.Stein, M.Asplund: Solar Surface Convection, Living Reviews in Solar Physics, 2009
Granulation on stars Synthetic images [negative] of granulation in four stellar models From top: Procyon (F5 IV-V), Alpha Cen A (G2 V), Beta Hyi (G2 IV), & Alpha Cen B (K1 V). Disk center (=1), and two positions towards the limb. D.Dravins & Å.Nordlund Stellar Granulation IV. Line Formation in Inhomogeneous Stellar Photospheres A&A 228, 84
Same spectral line in different stars Adapted from Dravins & Nordlund, A&A 228, 203
A visible imaging FTS for E-ELT with XAO & integral-field-unit covering a stellar disk? ( Jean-Pierre Maillard, Institut d’Astrophysique de Paris )
Common fallacy: Belief that high optical efficiency is crucial to scientific discovery
Still … A grand challenge: Design an efficient R = 1,000,000 high-fidelity spectrometer for ELTs!