Download
1 / 23
230 likes | 313 Views
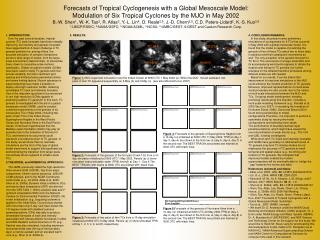
A Global Climatology of Baroclinically Influenced Tropical Cyclogenesis. Authors: Ron McTaggart -Cowan, et. Al. Monthly Weather Review June 2013. Purpose.

E N D
A Global Climatology of Baroclinically Influenced Tropical Cyclogenesis Authors: Ron McTaggart-Cowan, et. Al. Monthly Weather Review June 2013
Purpose • The authors had previously produced a dynamically based genesis pathway climatology for the North Atlantic in hopes of expanding upon the understanding, and thusly the prediction of TC genesis. (McTaggart-Cowan, 2008) • This paper expands upon the climatology to include all of the world’s active tropical basins.
Data and Methodology • Period of 1948-2010 • “combined reanalysis” • NCEP-NCAR reanalysis I • ERA-40 • ERA-Interim • JRA-25 (Japan Meteorological Agency) • T₀ defined as first report in IBTrACS
Data and Methodology • 2 metrics were used for characterization • Q – average convergence of the 400-200hPa Q vector. • Represents synoptic scale forcing for ascent. • TH – max difference between 1000–700-hPa thickness values in two hemispheres within 10⁰ of point of interest. • lower level thickness asymmetry. Note: Background state rather than vortex itself.
Data and Methodology Do these seem like good metrics to use? From figure 1 of Ron McTaggart-Cowan, et. Al. 2007
Data and Methodology • Linear discriminant analysis is employed. • 5 development pathways are identified. • Note: different classification technique was used here from the Atlantic paper. • As a result 1 less category is used (transient trough interaction pathway is omitted)
The 5 development pathways The reclassification of the North Atlantic TC pathways provides a look at the classification metric space.
Global climatology frequency • Non baroclinic –within 15⁰ of equator • Low level baroclinic – areas with land-sea contrasts or SST gradients • Trough induced – equatorward and west of Rossby wave breaking centers • Weak TT – near TUTT axis • Strong TT – higher latitudes due to Rossby wave breaking.
Classification Accuracy Assessment • Do you think this is a good technique to accomplish the objective? • Do you foresee any issues that might influence the accuracy of the classification? • A thorough comparison with previous studies and a subjectively classificatied sample was done. • [Gray (1968), Hess et al.(1995), Elsner et al.(1996)] • Their classification compared very favorably!
Relative frequency of TC development pathway by basin What can we learn from this figure? • Non-baroclinic pathway dominates in all basins. • But, secondary pathway varies. • Strong TT is generally least prolific
North Atlantic Figure 8
East Pacific Figure 9
West Pacific Figure 10
Bay of Bengal – North Indian Figure 11
Arabian Sea – North Indian Figure 12
South Indian Figure 13
South Pacific Figure 14
Development Efficiency What can we learn form this figure? Figure 15 Equivalent to dividing figure 7 by figure 4
Climatology in Metric Space • Left: are all of the formation events plotted in metric space along with formation density. • Note maximum in non-baroclinic space • Right: is the percentage of time that the metrics lie close to a given position in metric space. How do we interperate these figures? Figure 16 Genesis events Environmental
TC efficiency in Metric Space • Yield value of 1 is average • The presence of an upper level disturbance is more favorable than purely non-baroclinic (Gray1988) Trough Ridge Figure 17 Figure 16 Fig. B divided by fig. A
Discussion • Non-baroclinic TC developments dominant globally, but a “rich spectrum” of formation events happen under baroclinic conditions. • 70% non-baroclinic • 8% Low level baroclinic • 6% Trough induced • 11% weak Tropical transition • 5% Strong TT • Could be combined with traditional genesis potential evaluation techniques to develop a pathway conditional index. • It is hoped that this could be an improvement on current indices.
Discussion • So, what do you think? • Were they successful? • Was this a worthwhile exercise? • Could it help improve genesis prediction? • Do you feel there are any other important takeaways from the climatology?