Download
1 / 30
300 likes | 463 Views
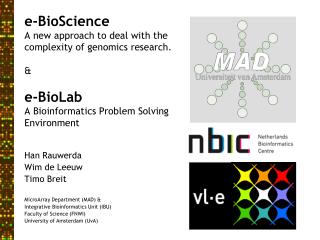
'A bioinformatic Problem Solving Environment in the e-BioLab' VL-e Sub Program 1.5: Bioinformatics. Timo Breit Micro-Array Department & Integrative Bioinformatics Unit Faculty of Science, University of Amsterdam. Food Informatics. Dutch telescience. Medical diagnosis. Bio diversity.

E N D
'A bioinformatic Problem Solving Environment in the e-BioLab'VL-e Sub Program 1.5: Bioinformatics Timo Breit Micro-Array Department & Integrative Bioinformatics Unit Faculty of Science, University of Amsterdam
Food Informatics Dutch telescience Medicaldiagnosis Bio diversity Where in the Virtual Laboratory for e-Science? BioInformatics Problem Solving Environment Data intensivescience Bioinformatics ‘BI- PSE’ Application Layer Generic Virtual Laboratory e-science layer Grid Layer
RNA analysis by micro-array: 1.000-40.000 genes A B C D E F G H I J K L M N O P Q R S T Why in the VL-e?Data explosion in life sciences research. RNA analysis by Northern blot: 1-15 genes A B C D E F G H I J K L M N O P Q R S T Analyzed genes Samples of cellular experiments
Informatics ICT infrastructure Life sciences research today:whole system –omics data. Biology Biotechnology Bioinformatics Biologist DNA Genomics Data storage Data handling Data preprocessing Data analysis Data integration Data interpretation Experiment RNA Transcriptomics protein Proteomics metabolite Metabolomics Results Integrative biology or Systemsbiology
Hypotheses Results X ICE ESE DSE ICE: Interactive & Creative Environment ESE: Experiment Support Environment DSE: Decision Support Environment How in VL-e?A bioinformatics problem solving environment (BI-PSE) a.o.: domain knowledge domain information domain data Life sciences domain Hypothesis generation Experiment design Wet-lab experiment Enhancing knowledge model Decision process In-silico experiment e-bio science a.o.: semantic modeling Problem solving environment Generic virtual laboratory a.o.: analysis methods information management semantic modeling adaptive inf. disclosure a.o.: security (AAA) ICT infrastructure Grid- layer RESULT: Rauwerda et al: The Promise of a virtual lab. Drug Discov Today. 2006 Mar;11(5-6):228-36.
Staff SS Han Rauwerda SP vacancy e-BioLab M-A ESE Microarray analyses methods workflows Resource ICE Resources identification model IB-ICE IB-ESE Integrative bioinformatics knowledge model experiment design Staff MAD Martijs Jonker MAD Oskar Bruning Staff PD Marcia ad Inda SP vacancy Staff PD Christian Henkel PD Ramin Monajemi Staff PD Scott Marshall PD Tessa Pronk SP Frans Verster Staff PD Marco Roos AIO Lennart Post VL-e Use case SigWin VL-e Use case Histone Parts of the BI-PSE we work on Biological use case Huntington Disease Biological use case Toxicogenomics VL-e Grid computing
Basic configuration of e-BioLab VL-e use case SigWin finder Goal: A workflow to find significant windows in data related to a given sequence (of any type). Motivation: Find sets of genes (windows) with increased overall gene expression (significance) in expression data ordered by gene location on the chromosomes (sequence).
Basic configuration of e-BioLab SigWin: Significant Windows* Márcia Alves de Inda, Dimitri, Frans Verster, Marco Roos Given a data set we compute Sliding Window (SW) Medians for a given window size. Using the SW Medians data we compute a False Discovery Rate (FDR) threshold. Windows with values above the FDR threshold are called significant windows (or Windows Beyond the Threshold) *R. Versteeg et al. Genome Res 2003 13: 1998-2004.
Basic configuration of e-BioLab VLAM SigWin-finder workflow Modules 1) Read sequence 2) Rank sequence 3) SW Medians 4) Sample to Frequency 5) SW Medians Prob 6) FDR Threshold 7) WinBeTs 8) GnuPlot
Basic configuration of e-BioLab SigWins and periodic data
Basic configuration of e-BioLab Example periodic data: Temperature in Amsterdam
Basic configuration of e-BioLab Integration genomic & transcriptomics data
Basic configuration of e-BioLab Integration genomic & transcriptomics data (zoom)
Histone modification Transcription factor Histones Transcription Transcriptionfactor binding site Basic configuration of e-BioLab VL-e use case Histone code and semantic modeling Lennart Post, Scott Marshall, Marco Roos Hypothesis A relationship exists between histone modification and transcription factor binding sites
Basic configuration of e-BioLab Design ‘myModel’: Protégé - OWL plug-inhttp://protege.stanford.edu
Basic configuration of e-BioLab Data integration through semantic modeling
L L Basic configuration of e-BioLab Result data integration via semantic modeling UCSC genome browser snapshot Overlap etc… Result: Correlation between histone modification and transcription factor binding sites
Basic model of problem area Small integration experiments + integration methods Readily accessible data + models data mining Vague results Easy visualization e-BioOperator Biologists Biologists e-BioScientist non formalized knowledge + ideas + intuition + discussion Domain interaction: Basic concept of an e-BioScience Laboratory (e-BioLab) Bioinformatics Problem Solving Environment Methods Tools Workflows Grid
Basic configuration of e-BioLab Basic set-up of the e-BioLab
Basic configuration of e-BioLab Anticipated tiled display in e-BioLab 2 Gene lists SOM Hier.clust. 1 3 Video remote collaboration P1 cluster 1 P1 cluster 2 P1 cluster 3 P2 cluster 1 P2 cluster 2 P2 cluster 3 Remote whiteboard Chrom.map 1 Pathways displayed P3 cluster 1 P3 cluster 2 P3 cluster 3 Chrom.map 2 Chrom.map 3
Basic configuration of e-BioLab Acknowledgements Within SP1.5: Marco Roos Molecular biologist Han Rauwerda Bioinformaticia Roel van Driel Biochemist Christiaan Henkel Molecular Biologist Lennart Post AIO (vDriel) Martijs Jonker Bioinformatician Marcia Alves de Inda Computational scientists Oskar Brunning Bioinformatician Scott Marshall Informatician Tessa Pronk Molecular biologist Frans Verster Scientific programmer Ramin Monajemi Informatician Timo Breit Molecular biologist Within VL-e SP1.2; use ontologies in semantic modeling SP1.4; use case R on Grid, e-bioscience SP2.2; AID; ontologies and semantic modeling SP2.4; information management SP2.5; workflow methods and tools Sp3.3; e-BioLab SP4.1: VLEIT team Vacancies @ IBU: Bioinformatician: micro-array data analysis (HBO/WO, 2 years) Scientific Programmers: building the e-BioLab • Outside VL-e • BioRange, NBIC; Dutch bioinformatics • Content driven data modeling (Kok-LUMC, Adriaans,-UvA etc…) • Test case systems biology (RUG, CMBI, TNO, UvA, etc…) • SigWin (vKampen-AMC etc…) • E-BioLab (vdVeer-VU, vd Vet-UT, Nikhef, SARA,etc…) • BioAssist • - Microarray workflow (many….) • - Reannotatie (Leunissen-WU, Neerincx-WU etc…) More information: www.micro-array.nl
BioRange & BioAssist Food Informatics Dutch telescience Medicaldiagnosis Bio diversity Where in the Virtual Laboratory for e-Science? Integrative Bioinformatics Problem Solving Environment Data intensivescience Bioinformatics ASP ‘IB- PSE’ Application Layer Generic Virtual Laboratory e-science layer Grid Layer
Subprograms & research themes in national bioinformatics initiative BioRange. Bioinformatics Informatics ICT infrastructure
Use cases (user scenarios) • R on grid (IUC1.5.1) (finished) • Creation of a web service that executes an R-script that invokes a LAM-MPI distributed calculation on the grid on a number of nodes that can be chosen by the user. • R in workflows (IUC1.5.4) (started) • Proof of principle of a micro-array analysis workflow by invocation of web services. Requirements are visualization of intermediate results and enabling human interaction. • Re-annotation of micro-array libraries (IUC1.5.5) (started, with J. Leunissen WU) • Re-annotation from sequence by invocation of remotely hosted web services in a workflow environment. • ‘SigWin’ (IUC1.5.3) => Significant Window Finder (proof of principle given) • Generalization of method that finds ‘Regions of IncreaseD Gene Expression’ (RIDGEs) into workflow in VLAM environment that finds significant windows in sequences of values. • Histone Code case 1 (IUC1.5.2) (proof of principle given) • Proof-of-concept data integration via semantic models • Scaling problems semantic data integration (RUC1.5.1) (Finished, lead to 2 new IUCs) • Provide guidelines for the infrastructure to use for semantic data integration
A view on bioinformatics research and IBU IBU Bio - - informatics Informatics research Bioinformaticsresearch Appliedbioinformatics Biologyresearch
Outline of presentation. • Where are we in positioned in the VL-e project? • Why do we need a Integrative Bioinformatics Problem Solving Environment? • What do we want to do with a IB-PSE? • How do we think to create a functional IB-PSE? • Who are we? • Where do we start? • When do we think we will have a functional IB-PSE? • Who are our collaborators?
What do we want to do with a IB-PSE?Concept of integrative bioinformatics Biological research domain e-bioscience core domain Enabling science domain Model Omics data Data- driven hypothesis Analysis methods Integrative & computational bioinformatics experiment Experiment design VL-e Biological knowledge biological problem Problem- driven hypothesis ICT infra- structure Visualization Biological phenomena Biological solutions
Ontology B Ontology A Semantic modelling Semantic modelling Interface model A Interface model B Computationalexperiment Data source B Computational experimentation through advanced data integration. Data source A
NBIC, national foundation for Dutch bioinformatics. Involves all academic and several industrial life sciences research organizations. • BioASP, Bioinformatics Service Provider for life sciences researchers by NBIC and “Nationaal Regieorgaan Genomics”. BiOrange, bioinformatics Bsik project by NBIC and “Nationaal Regieorgaan Genomics”. NBIC- Bioinformatics Bio- Application Support Program (Bio-ASP) BioRange Bioinformatics Research Life sciences researchers mainly focused on resolving specific life sciences research questions. Local bioinformatics initiatives,mainly focused on directly supporting specific local life sciences research questions. VL-e Consortium- Informatics • VL-e, informatics Bsik project by WTCW supporting BiOrange. Bioinformatics in the Netherlands BiOrange Proof-of- concept Environment VL-E Exploitation Environment (SARA) VL-E Proof-of- concept Environment VL-E Experimental (rapid prototyping) Environment University of Amsterdam
Data integration: basic concept of any cell history stimuli program response mechanism component interaction presence state DA LC ED DA DI Assumption: the complexity of life is organized via a limited number of general cellular mechanisms.