Download
1 / 24
240 likes | 373 Views
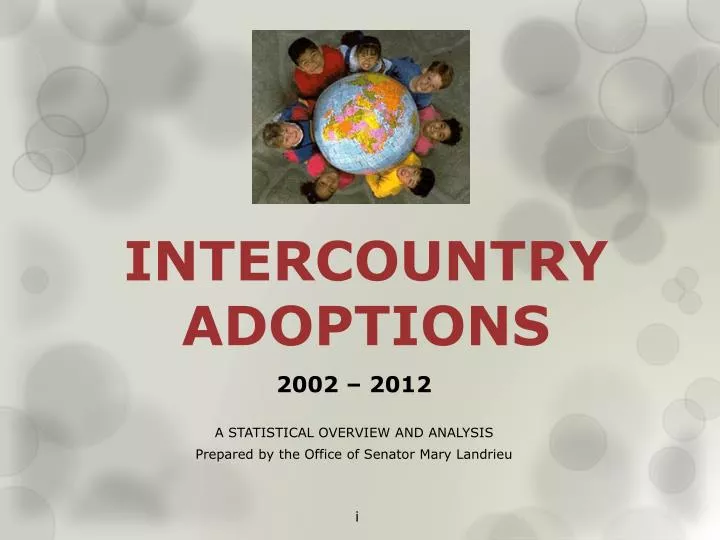
INTERCOUNTRY ADOPTIONS. 2002 – 2012 A STATISTICAL OVERVIEW AND ANALYSIS Prepared by the Office of Senator Mary Landrieu. i. INTERNATIONAL ADOPTION IN DECLINE WORLDWIDE. WORLDWIDE DOWNTURN. U.S. DOWNTURN. 62%. NON-U.S. DOWNTURN. 38%. MAIN POINTS:.

E N D
INTERCOUNTRYADOPTIONS 2002 – 2012 A STATISTICAL OVERVIEW AND ANALYSIS Prepared by the Office of Senator Mary Landrieu i
U.S. DOWNTURN 62%
MAIN POINTS: • Intercountry adoptions by all receiving countries have declined by almost half when the number of children living without families has continued to grow. • Intercountry adoptions to the U.S. have declined 24% faster than to the rest of the world.
HOW ADOPTIONS TO U.S. FELL 2004-2005: 257. Russian adoptions fell by 1,200 but Guatemala and China grew to offset loss. 2005-2006: 2,054 Chinese and Russian adoptions fell by 1,500 and 900 respectively. Modest growth elsewhere helped offset loss. 2006-2007: 1,072. Chinese and Russian adoptions still falling fast. Offset by growth in Guatemala, Vietnam, and Ethiopia. 2007-2008: 2,152. Chinese, Russian and Guatemalan adoptions falling. Growth in Ethiopia. 2008-2009: 4,712. Closure of Guatemala due to Hague entry into force in U.S. led to drop of over 3,500. China also down by 900. Ethiopia still growing. Hague entered into force in U.S.
HOW ADOPTIONS TO U.S. FELL 2009-2010: 1,674. Guatemala and Vietnam programs ended completely. Russia declined. Ethiopia and China grew to offset. 2010-2011: 1,774. China and Ethiopia both down 800 each. 2011-2012: 570. Most countries declined, although not sharply. 2012-2013 estimate: 800 or more. Russia has banned all adoptions to the U.S. for a drop of 800. IF THE U.S. HAD MAINTAINED THE 2004 LEVEL OF INTERNATIONAL ADOPTIONS, INSTEAD OF EIGHT STRAIGHT YEARS OF DECLINE: NEARLY 62,000 MORE CHILDREN WOULD HAVE FAMILIES.
HAGUE VS. NON-HAGUE IN 2009 • In 2009, U.S. families adopted 12,744children internationally: • 12,031 non-Hague adoptions (94%) • 713 Hague adoptions (6%)
ADOPTIONS TO THE U.S. 2009 • Top sending countries for 2009 (100+ arrivals in the year): • 4 Hague: • China • India • Colombia • Philippines • 10 Non-Hague • Ethiopia • Russia • South Korea • Ukraine • Uganda • Taiwan • Nigeria • Congo • Haiti • Ghana
HAGUE VS. NON-HAGUE IN 2010 • In 2010, U.S. families adopted 11,058children internationally: • 8,768 non-Hague adoptions (79%) • 2,290 Hague adoptions (21%)
ADOPTIONS TO THE U.S. 2010 • Top sending countries for 2010 (100+ arrivals in the year): • 4 Hague: • China • India • Colombia • Philippines • Kazakhstan • 9 Non-Hague • Ethiopia • Russia • South Korea • Ukraine • Taiwan • Nigeria • Congo • Haiti • Ghana
HAGUE VS. NON-HAGUE IN 2011 • In 2011, U.S. families adopted 9,319children internationally: • 6,584 non-Hague adoptions (71%) • 2,735 Hague adoptions (29%)
ADOPTIONS TO THE U.S. 2011 • Top sending countries for 2011 (100+ arrivals in the year): • 10 Non-Hague • Ethiopia • Russia • South Korea • Ukraine • Uganda • Taiwan • Nigeria • Congo • Ghana • Jamaica • 4 Hague: • China • Philippines • India • Colombia
HAGUE VS. NON-HAGUE IN 2012 • In 2012, U.S. families adopted 8,668children internationally: • 5,043 non-Hague adoptions (58%) • 3,625 Hague adoptions (42%)
ADOPTIONS TO THE U.S. 2012 • The children adopted came from 27 Hague countries and 34 non-Hague countries. • Top sending countries for 2012 (100+ arrivals in the year): • 5 Hague: • China • Colombia • India • Bulgaria • Philippines • 10 Non-Hague • Ethiopia • Russia • South Korea • Ukraine • Congo • Uganda • Nigeria • Taiwan • Ghana • Haiti
MAIN POINTS: • Hague adoptions are a growing percentage of an decreasing number of adoptions • Hague adoptions growing at an anemic pace • A few countries account for the large majority of adoptions to the U.S. • China is the only large sending country that is also a Hague partner
HAGUE COUNTRIES THAT NEED HELP IMPROVING THINGS • Cambodia – closed since 2001 • Guatemala – closed since 2008 • Kenya – non-functioning since Hague • Romania – closed since 2004 • Cape Verde, Fiji, Montenegro, Rwanda, and Senegal – closed, U.S. considers non-compliant • Vietnam – closed since 2008, although other countries actively working there
NON-HAGUE COUNTRIES THAT CAN GROW AND IMPROVE TOO • Dem Rep. of Congo –growing program • Ethiopia –program struggling • Ghana –program suspended • Haiti – working to join Hague • Nigeria –growing program • Uganda –growing program
MAIN POINTS: • U.S. Central Authority does not work proactively with other countries to develop international adoption programs. • Children who need families are the victims of this lack of U.S. Government action. • We can do better.