Download
1 / 15
150 likes | 226 Views
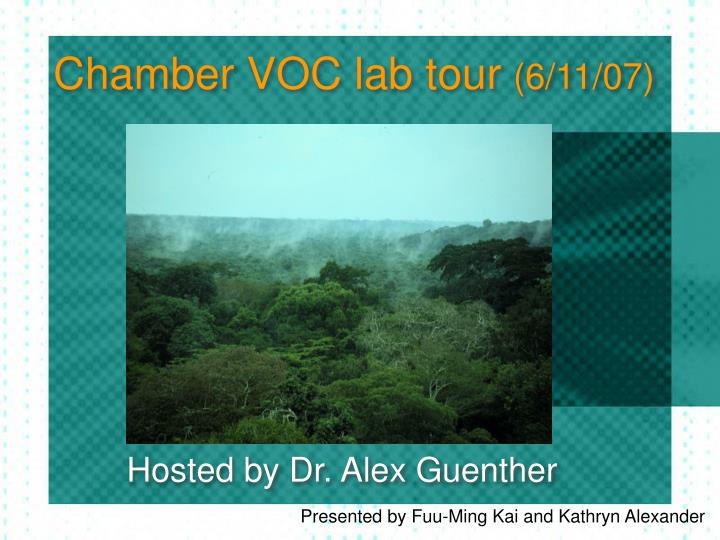
Chamber VOC lab tour (6/11/07). Hosted by Dr. Alex Guenther. Presented by Fuu-Ming Kai and Kathryn Alexander. What do we learn?. Background of trace gas emission measurements Lab tour: explore various techniques and indoor experiments. Introduction. Trace gas emission

E N D
Chamber VOC lab tour (6/11/07) Hosted by Dr. Alex Guenther Presented by Fuu-Ming Kai and Kathryn Alexander
What do we learn? • Background of trace gas emission measurements • Lab tour: explore various techniques and indoor experiments
Introduction • Trace gas emission • Includes technological and natural sources • Affect air quality • Emission Measurement Methods • Micrometeorological methods • Mass balance methods • Tracer ratio methods
Micrometerological Methods • Quantify the net movement of a trace gas/particle in the turbulent boundary layer. (e.g. Eddy Covariance) • Advantages: • Do not disturb the source • Issues must be considered • Sampling time • Sensor requirements • Where to sample
Mass Balance Methods • Flux = dC/dt +U + S U: the change due to transport S: chemical loss and production Flux: exchange between the air and other components • Methods • Enclosure Approach • Boundary Layer Approach • Global Budget Approach
Tracer Ratio Methods • Use a tracer gas to estimate the flux a target gas. • Requirement: • The tracer and target gases must have similar source distributions and be transported in a similar manner. • Advantages: • No meteorological measurements or dispersion modeling is required.
Laboratory Studies 1. Methanol and acetone emissions from vegetation - Dominant chemicals to total Biogenic Volatile Organic - Characterize variations in the emission rates - Use them as the basis of a new model 2. Response of biogenic isoprene emission to elevated ozone - High isoprene emissions --> high ozone concentration - Conduct investigation under controlled laboratory conditions
Green House The Layout of BVOC lab • Simple demonstration • Cover the leaf with black card, and observe the change in CO2 Controlled greenhouse Mass Spectrometry Infrared Analyzer (Licor) For [CO2} GC (Gas Chromatography) Ozone Detectors and misc.
Leaf and Plant Studies Closing down the Mesa Lab facilities Process study results are used to develop numerical algorithms suitable for regional and global modeling and developing new Foothills Lab facilities Response of isoprene and photosynthesis to drought (Pegoraro et al. 2004) Particle production occurs when ozone is added to plant chamber (VanReken et al. 2006)
Thank you very much for Alex Guenther and his group members for giving the worthwhile tutorial and providing slides and pictures.