Download
1 / 37
370 likes | 595 Views
Flooding in Pequannock Township. Understanding Flooding on the Pompton River. Major Floods. May 1968. March 2010. April 1984. “Minor” Floods. Harrison Road. Pompton River at Jackson Ave. March 21, 2003. Many Floods. River Flooding.

E N D
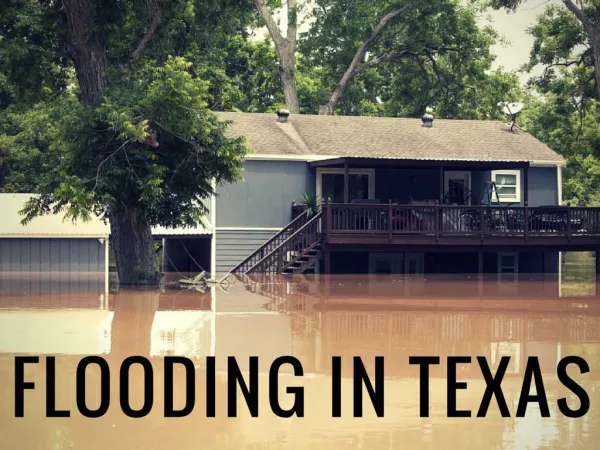
Flooding inPequannock Township Understanding Flooding on the Pompton River
Major Floods May 1968 March 2010 April 1984
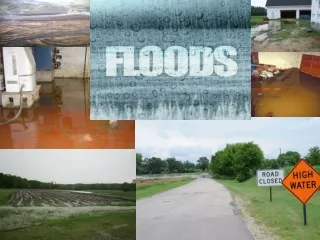
“Minor” Floods Harrison Road Pompton River at Jackson Ave March 21, 2003
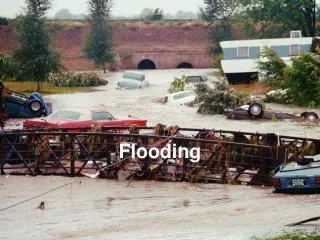
River Flooding • Severe Flooding in Pequannock Township results from River Flooding on the Pequannock and Pompton Rivers: • The volume of water coming from upstream exceeds the capacity of the river which then overflows into surrounding area’s and / or • The volume of water entering the Pompton River exceeds the volume that flows out at the Passaic River, causing water in the Pompton to get “backed up” filling the river basin.
Local Drainage • Rainfall in the Western section of the Township flows South through the East & West ditches to Beaver Brook in Lincoln Park, then to the Pompton River. • Rainfall in the Eastern section of the Township flows East directly to the Pompton River through small local streams and brooks. • These same Streams carry flood waters from a rising Pompton River back into the neighborhoods they drain. • Flood Gates provide protection from a rising river until the water level overtops Route 23.
Changes in Flood Evolution • Every Flood event evolves differently • Flood Evolution is impacted by: • River Height at the start of a Storm • Length & Intensity of Rain • Groundwater Level & Ground Saturation
The effect of Route 23 • Homes flooded in 1968 (River Height 22.18’) had no water in 2010 (22.78’) • Homes with over 2 feet of water in 1984 (River Height 24.47’) had no water in 2010 • The Reconstruction of Route 23 was completed in 1986–87 which raised the road surface and added a concrete median.
The Pompton River • Forms at the convergence of three rivers at the Northeast corner of Pequannock Township. • The Pequannock River • The Wanaque River • The Ramapo River • Drains an area of 355 square miles in Northern New Jersey and Southeastern New York Sate. • One inch of rain over the basin produces 6,169,025,280 Gallons, or 824,736,000 Cubic Feet of water. • Base River Elevation – 160’ at Jackson Avenue
A small river drains a large area • Historical Crests for Pompton River at Pompton Plains(1) 24.47 ft on 04/06/1984(2) 22.78 ft on 03/14/2010(3) 22.18 ft on 05/30/1968(4) 21.72 ft on 04/16/2007(5) 21.00 ft on 09/17/1999(6) 20.42 ft on 04/03/2005(7) 20.37 ft on 02/03/1973(8) 19.56 ft on 04/10/1980(9) 18.65 ft on 11/09/1977(10) 17.86 ft on 10/09/2005(11) 17.56 ft on 10/13/2005(12) 16.96 ft on 01/28/1996(13) 16.90 ft on 03/31/2010(14) 16.78 ft on 12/12/2003(15) 16.32 ft on 05/12/1998(16) 14.86 ft on 10/21/1996(17) 14.86 ft on 12/02/1996
The Pequannock River • Flooding impacts Harrison Road section • Floods more frequently than other area’s of Township • Drains from Hamburg Mountain Southeast • At the point of the Macopin Dam (along Rt. 23) it drains 63.7 square miles • There are Four (4) Reservoirs along the Pequannock which are part of the City of Newark Water Supply • Elevation – 549 feet at Macopin Dam
The Wanaque River • At the gauge just downstream from the Raymond Dam, the river drains an area of 90.4 square miles • A minimal base flow of approximately 20 cubic feet per second (cfs) unless the Wanaque Reservoir is full • There are two Reservoirs on the river owned by the North Jersey District Water Supply Commission (NJDWSC) • Elevation – 210 feet at Wanaque Avenue
The Ramapo River • At Dawes Highway, the Ramapo River drains an area of 160 square miles • There are no true reservoirs on the Ramapo River • Diversion from Pompton Lake can be used to fill the Wanaque and Oradell Reservoirs (Capacity = 300,000,000 Gallons) • Elevation – 175 feet at Dawes Highway; 253 feet at Route 17 (Mahwah)
The Passaic River • At Two Bridges, the Passaic River drains an area of 734 square miles • Base River Elevation – 155 feet at the mouth of the Pompton River • The Passaic River at Two Bridges rises slower and crests later than the Pompton • High water levels on the Passaic can slow the drainage of the Pompton, causing it to back up into low lying area’s
Aggravating & Mitigating Factors • River System Capacity • Shallow Slope / Sedimentation • Reservoir Capacity • Ground Conditions • Saturation / Ground Water / Frozen • Snow • Foliage • Precipitation Rate
River Capacity • River systems are capable of handling significant increases in flow before they flood • The median flow of the Pompton River at Jackson Avenue is 345 cfs, or 222 Million Gallons per Day • The approximate flow at Flood stage is 8,000 cfs, or 5.15 Billion Gallons per Day • The lower the river flow at the start of a rain event, the more capacity there is to handle flow without flooding.
Reservoir Capacity • Total Capacity of the Wanaque Reservoir is 29.6 Billion Gallons • As long as the Wanaque Reservoir is below capacity there is effectively no flow into the Pompton from the Wanaque, decreasing the drainage area by ¼ (90 sq mi) • At 75% of capacity, the Wanaque Reservoir can absorb 4.7” of rain without adding flow to the Pompton • Newark’s Reservoirs on the Pequannock River have a combined capacity of 14.4 Billion Gallons.
Forecasting Flooding • Weather Reports • NWS Watches & Warnings • NWS River Forecasts • Advanced Hydrologic Prediction Service • Monitoring Conditions • Rainfall • River Levels • Reservoir Levels
River Level Predictions • Using Information from: • Actual Rainfall Totals & Rainfall Predictions • Review NWS – AHPS River Forecasts • Watch Upstream Rivers • Total Flow & Rate of Rise • Watch Upstream Reservoirs • Predict when Reservoirs will reach Capaicty • Watch Pompton Lake • Predict Gate Activation • Manually watch all local Stream & River Levels
Predicting Impacts • How High will the Water Get? • Use of Forecasting Tools & Experience • What will the impacts be? • Closed Roads & Access • Flooded Streets • Flooded Homes & Businesses • When will Streets be impassable? • When will Businesses be Impacted? • When will Homes be subjected to Interior Flooding?
Management Decisions • Timing vs Accuracy • Notification vs Evacuation • Time of Day Impacts – Who is Home? • Work Day / Weekend • School Day • Late Night • Flood Precautions for Businesses / Homeowners in light of Evacuation
Getting Information Out • Township Website • Cable Channel 77 • Flood Information Phone (Recreation Line) • Reverse 9-1-1 • Door to Door Notifications • Under Consideration: • AM Radio Broadcast Channel • Instant Alert – Subscriber based Text, E-mail or Phone
Agency Roles • Police – Maintain Response Capability • Increased Demand on Communications Center • Traffic, Detours & Road Closures • Security for Closed Businesses & Neighborhoods • Fire – Maintain Response Capability • Notifications, Evacuations, EMS Support, Water Rescue • EMS – Maintain Response Capability • Support for Fire Operations, Shelter Support
Agency Roles • DPW • Check & Clear Drains, Waterways & Flood Gates • Maintain Operation of Water & Sewer Infrastructure • Barricades for Road Closures & Detours • Storm Debris removal from Streets • Health Department • Human & Animal Shelter Operations • Recreation • Coordination of Community Volunteer Efforts
Agency Roles • Engineering • Evaluate Impact / Stability of Municipal Infrastructure • Prepare Damage Assessments • Construction Code Office • Evaluate Damaged Buildings • Assist Residents in Permitting / Repair Efforts
Office of Emergency Management • The Office of Emergency Management (OEM) coordinates activities of all local agencies and obtains resources needed by response crews. • In support of this mission, OEM may: • Activate the Emergency Operations Center (EOC) • Declare a Local State of Emergency • Call on Specific Resources to assist Local Agencies • Maintains contact with County & State Emergency Officials to keep abreast of Regional Conditions & request additional resources, if needed.
Receding Water • Clear Debris and Open Roadways • Access Control to Flooded Neighborhoods • Ensure Safety of Flooded Homes • Distribute Clean up Kits • Coordinate Community Volunteers • Food; Clean-up; Donations • Coordinate with County & State OEM; FEMA • Documentation of Damage, Costs & Activities
Recovery • Debris Pick-up, Removal & Disposal • Repair of Municipal Facilities & Infrastructure • Contact with every affected Business & Homeowner • Safety Inspections for Businesses • Health, Fire & Construction where required • Construction Code Inspections for Home Repairs
Flood Insurance • Not covered by Homeowner’s • Sponsored & Underwritten by NFIP (FEMA) • Required by Mortgage for Properties in Flood Plain • Structure Coverage / Contents Coverage • Discounts through Community Rating System (CRS) • Repetitive Loss / Severe Repetitive Loss
Pompton Lake Floodgates • No downstream notification of operations • Disrupts Local Flood Elevation Forecasting • Can quickly inundate areas thought to be safe • Disrupt Evacuation Efforts • Complicate Rescue Operations