Download
1 / 78
830 likes | 1.15k Views
Oligopoly. Chapter 10. Market Structure. Most firms possess some market power. Degrees of Power. We classify firms into specific market structures based on the number and relative size of firms in an industry. Market structure – The number and relative size of firms in an industry.

E N D
Oligopoly Chapter 10
Market Structure • Most firms possess some market power.
Degrees of Power • We classify firms into specific market structures based on the number and relative size of firms in an industry. • Market structure – The number and relative size of firms in an industry.
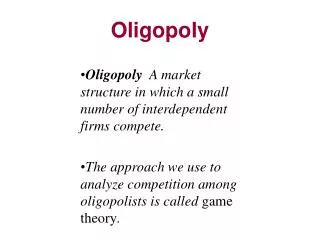
Degrees of Power • In imperfect competition, individual firms have some power in a particular product market. • Oligopolyis a market in which a few firms produce all or most of the market supply of a particular good or service.
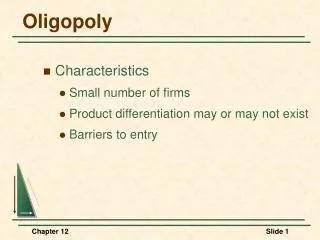
Determinants of Market Power • The determinants of market power include: • Number of producers. • Size of each firm. • Barriers to entry. • Availability of substitute goods.
Determinants of Market Power • Market power increases: • The fewer the number of firms in the market. • The larger the relative size of the firms in the market. • The higher the entry barriers. • The fewer the substitutes.
Determinants of Market Power • Barriers to entry determine to what extent the market is a contestable market. • Contestable market – An imperfectly competitive industry subject to potential entry if prices or profits increase.
Measuring Market Power • The standard measure of market power is the concentration ratio. • The concentration ratio is a measure of market power that relates the size of firms to the size of the market.
Concentration Ratio • Theconcentration ratio is the proportion of total industry output produced by the largest firms (usually the four largest).
Firm Size • Market power isn’t necessarily associated with firm size. • A small firm could possess a lot of power in a relatively small market.
Measurement Problems • Many smaller firms acting in unison can achieve market power. • Concentration ratios do not convey the extent to which market power may be concentrated in a local market.
Oligopoly Behavior • Market structure affects market behavior and outcomes. • Assume that the computer market has three oligopolists.
Initial Equilibrium • Initial conditions and market shares of each firms are described in the following slides. • Market share - The percentage of total market output produced by a single firm.
$1000 Market demand Price (per computer) 0 20,000 Quantity Demanded (computers per month) Initial Conditions in Computer Market Industry output
The Battle for Market Shares • In an oligopoly, increased sales on the part of one firm will be noticed immediately by the other firms.
Increased Sales at the Prevailing Market Price • Increases in the market share of one oligopolist necessarily reduce the shares of the remaining oligopolists.
Increased Sales at Reduced Prices • Lowering price may expand total market sales and increase the sales of an individual firm without affecting the sales of its competitors. • There simply isn’t any way that a firm can do so without causing alarms to go off in the industry.
Retaliation • Oligopolists respond to aggressive marketing by competitors. • Step up marketing efforts. • Cut prices on their product(s).
Retaliation • One way oligopolists market their products is through product differentiation. • Product differentiation – Features that make one product appear different from competing products in the same market.
Retaliation • An attempt by one oligopolist to increase its market share by cutting prices will lead to a general reduction in the market price. • This is why oligopolists avoid price competition and instead pursue nonprice competition.
F $1000 G 900 Price (per computer) Market demand 0 20,000 25,000 Quantity Demanded (computers per month) Rivalry for Market Shares
The Kinked Demand Curve • Close interdependence – and the limitations it imposes on price and output decisions – is a characteristic of oligopoly.
Rivals’ Response to Price Reductions • The degree to which sales increase when the price is reduced depends on the response of rival oligopolists. • We expect oligopolists to match any price reductions by rival oligopolists.
Rivals’ Response to Price Increases • Rival oligopolists may not match price increases in order to gain market share.
The Kinked Demand Curve Confronting an Oligopolist • The shape of the demand curve facing an oligopolist depends on how its rivals responded to a change in the price of its own output. • The demand curve will be kinked if rival oligopolists match price reductions but not price increases.
1000 PRICE (per computer) 0 QUANTITY DEMANDED (computers per month) The Kinked Demand Curve Confronting an Oligopolist Demand curve facing oligopolist if rivals match price changes M B $1100 A D 900 C Demand curve facing oligopolist if rivals match price cuts but not price hikes Demand curve facing oligopolist if rivals don't match price changes 8000
Game Theory • Each oligopolist has to consider the potential responses of rivals when formulating price or output strategies. • The payoff to an oligopolist’s price cut depends on how its rivals respond.
Game Theory • Game theory is the study of decision making in situations where strategic interaction (moves and countermoves) between rivals occurs.
Game Theory • Each oligopolist is uncertain about its rival’s behavior. • The collective interests of the oligopoly are protected if no one cuts the market price. • But an individual oligopolist could lose if it holds the line on price when rivals reduce price.
The Payoff Matrix • The payoff to an oligopolist’s price cut depends on how its rivals respond.
é ù Probability of Size of loss Expected = ´ ê ú value rivals matching from price cuts ë û é ù + ´ Probability of Gain from lone ê ú rivals not matching price cut ë û The Payoff Matrix • The decision to initiate a price cut requires a risk assessment.
Oligopoly vs. Competition • Oligopolists may try to coordinate their behavior in a way that maximizes industry profits.
Price and Output • An oligopoly will want to behave like a monopoly, choosing a rate of industry output that maximizes total industry profit.
Price and Output • To maximize industry profit, the firms in an oligopoly must agree on a monopoly price and agree to maintain it by limiting production and allocating market shares.
Price or Cost (dollars per unit) 0 Quantity (units per period) Maximizing Oligopoly Profits Industry marginal cost Industry average cost Profit- maximizing price Market demand Profits Average cost at profit- maximizing output J Industry marginal revenue Profit-maximizing output
Sticky Prices • Prices in oligopoly industries tend to be stable. • Like all producers, oligopolists want to maximize profits by producing where MR = MC.
Sticky Prices • The kinked demand curve is really a composite of two separate demand curves. • There is a gap in an oligopolist’s marginal revenue (MR) curve. • Marginal revenue – The change in total revenue that results from a one-unit increase in the quantity sold.
Sticky Prices • As a result, modest shifts of the cost curve will have no impact on the production decision of an oligopolists.
S A Price (dollars per computer) F d1 G mr2 mr1 d2 0 H 8000 Quantity Demanded (computers per month) An Oligopolist’s Marginal Revenue Curve The kink in the demand curve The MR gap
Marginal revenue MC2 MC1 MC3 Price or Cost (dollars per unit) 0 Quantity (units per period) The Cost Cushion
Coordination Problems • There is an inherent conflict in the joint and individual interests of oligopolists. • Each oligopolist wants industry profits to be maximized. • Each oligopolist wants to maximize it’s own market share.
Coordination Problems • To avoid self-destructive behavior, each oligopolist must coordinate production decisions so that: • Industry output and price are maintained at profit-maximizing levels. • Each oligopolistic firm is content with its market share.
Price Fixing • The most explicit form of coordination among oligopolists is called price fixing. • Price fixing is an explicit agreement among producers regarding the price(s) at which a good is to be sold.
Examples of Price Fixing • Electric Generators - In 1961, General Electric and Westinghouse were convicted of fixing prices on electrical generators. • They were charged again in 1972 for continued price fixing.
Examples of Price Fixing • School Milk – Between 1988 and 1991, the U.S. Justice Department filed charges against 50 companies for fixing the price of milk sold to public schools in 16 states.
Examples of Price Fixing • Vitamins – Seven firms from four nations were accused of fixing global prices on bulk vitamins from 1990 - 1998.