Download
1 / 28
280 likes | 338 Views
Projecting transient populations - pragmatism or technical correctness? BSPS Conference Sep 2004 Richard Cooper Research team Nottinghamshire County Council. Joint Structure Plan housing figures. Regional Planning Guidance (1996-based) – 49,000 dwellings 2001-21

E N D
Projecting transient populations - pragmatism or technical correctness?BSPS Conference Sep 2004Richard Cooper Research team Nottinghamshire County Council
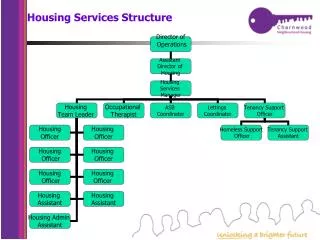
Joint Structure Plan housing figures • Regional Planning Guidance (1996-based) – 49,000 dwellings 2001-21 • Joint Structure plan accepts total • Distribution to sub-areas • South Nottinghamshire = 37,000 • Nottingham City – supply of 18,500
Population projections for Nottingham City • Basis is a ‘set’ number of dwellings • Early projections were dwelling-led but – • Migration levels varied widely • Migration-led projection needed • More robust output • More up-to-date information available • City wanted age / gender projection
Knowns and unknowns • How many houses – but not types of house, household or occupants • Age/gender of residents and migrants – but not future migrants • Characteristics of residents – but not how those may change
Modelling the population • Changing housing provision (e.g. more flats) • Assumptions that data in the model will still pertain - • the migration profile remains the same • characteristics (fertility, household generation, etc.) of population remain same for age, gender & relationship
Effects of ignoring the transient population • Age structure would have many more adults 35-44, (and fewer 15-24) • ageing through fertile and household creation ages • For a set number of dwellings (18,500) • 8,000 fewer (30% less growth) • For a certain migration level • 2,500 more dwellings
But why is this a problem (to Notts!) ? • Decision to use Patient Register data • From ONS & used in mid-year estimates • More up-to-date • More complete than the Census (includes students) • 3 years data - 1997-2000 • More accurate?
A problem ? (2) 3,000 more net in-migrants 15-19 – but are these all students?
A problem ? (3) • Transient population used where migration data does not handle flows adequately (1991 Census) • If migration data complete there is no need for a transient population - in theory OK • However, results did not show sensible outcome – it appeared that some student migrants were being excluded
Determining a transient population • Needed a reality check • Thought that transient population in CPHM was wrong for application to Patient Register migration • How do you decide on a transient population when some information is missing? • What should the relevant (20-24) population be doing? • It does not remain absolutely constant, even though student numbers may do so – so how does it change? • Look at births 20 years ago, not for absolute numbers – but for trends
Changes to 20-24 yr old population 2001 - 2016 Original projection has no transient adjustment May 2003 resulted from City suggestion in setting transient population Mar 2004 accounts for latest information and migration-led projection
How does it compare? (2) NB 1996 trend-based, so unusable for Structure Plan Methodology incorporated separate student ‘adjustment’
How does it compare? (2) Main difference is higher 35-54 population in JSP