Download
1 / 1
10 likes | 177 Views
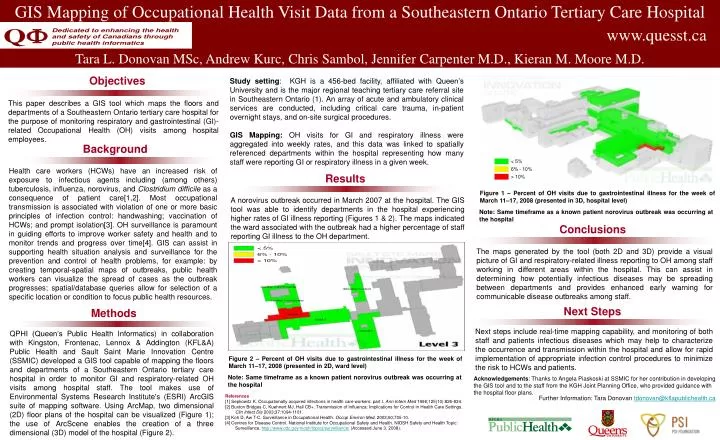
GIS Mapping of Occupational Health Visit Data from a Southeastern Ontario Tertiary Care Hospital Tara L. Donovan MSc, Andrew Kurc, Chris Sambol, Jennifer Carpenter M.D., Kieran M. Moore M.D. Background. www.quesst.ca. Objectives.

E N D
GIS Mapping of Occupational Health Visit Data from a Southeastern Ontario Tertiary Care Hospital Tara L. Donovan MSc, Andrew Kurc, Chris Sambol, Jennifer Carpenter M.D., Kieran M. Moore M.D. Background www.quesst.ca Objectives Study setting: KGH is a 456-bed facility, affiliated with Queen’s University and is the major regional teaching tertiary care referral site in Southeastern Ontario (1). An array of acute and ambulatory clinical services are conducted, including critical care trauma, in-patient overnight stays, and on-site surgical procedures. GIS Mapping:OH visits for GI and respiratory illness were aggregated into weekly rates, and this data was linked to spatially referenced departments within the hospital representing how many staff were reporting GI or respiratory illness in a given week. This paper describes a GIS tool which maps the floors and departments of a Southeastern Ontario tertiary care hospital for the purpose of monitoring respiratory and gastrointestinal (GI)-related Occupational Health (OH) visits among hospital employees. Health care workers (HCWs) have an increased risk of exposure to infectious agents including (among others) tuberculosis, influenza, norovirus, and Clostridium difficile as a consequence of patient care[1,2]. Most occupational transmission is associated with violation of one or more basic principles of infection control: handwashing; vaccination of HCWs; and prompt isolation[3]. OH surveillance is paramount in guiding efforts to improve worker safety and health and to monitor trends and progress over time[4]. GIS can assist in supporting health situation analysis and surveillance for the prevention and control of health problems, for example: by creating temporal-spatial maps of outbreaks, public health workers can visualize the spread of cases as the outbreak progresses; spatial/database queries allow for selection of a specific location or condition to focus public health resources. Results Figure 1 – Percent of OH visits due to gastrointestinal illness for the week of March 11–17, 2008 (presented in 3D, hospital level) A norovirus outbreak occurred in March 2007 at the hospital. The GIS tool was able to identify departments in the hospital experiencing higher rates of GI illness reporting (Figures 1 & 2). The maps indicated the ward associated with the outbreak had a higher percentage of staff reporting GI illness to the OH department. Note: Same timeframe as a known patient norovirus outbreak was occurring at the hospital Conclusions The maps generated by the tool (both 2D and 3D) provide a visual picture of GI and respiratory-related illness reporting to OH among staff working in different areas within the hospital. This can assist in determining how potentially infectious diseases may be spreading between departments and provides enhanced early warning for communicable disease outbreaks among staff. Next Steps Methods Next steps include real-time mapping capability, and monitoring of both staff and patients infectious diseases which may help to characterize the occurrence and transmission within the hospital and allow for rapid implementation of appropriate infection control procedures to minimize the risk to HCWs and patients. QPHI (Queen’s Public Health Informatics) in collaboration with Kingston, Frontenac, Lennox & Addington (KFL&A) Public Health and Sault Saint Marie Innovation Centre (SSMIC) developed a GIS tool capable of mapping the floors and departments of a Southeastern Ontario tertiary care hospital in order to monitor GI and respiratory-related OH visits among hospital staff. The tool makes use of Environmental Systems Research Institute's (ESRI) ArcGIS suite of mapping software. Using ArcMap, two dimensional (2D) floor plans of the hospital can be visualized (Figure 1); the use of ArcScene enables the creation of a three dimensional (3D) model of the hospital (Figure 2). Figure 2 – Percent of OH visits due to gastrointestinal illness for the week of March 11–17, 2008 (presented in 2D, ward level) Note: Same timeframe as a known patient norovirus outbreak was occurring at the hospital Acknowledgements: Thanks to Angela Piaskoski at SSMIC for her contribution in developing the GIS tool and to the staff from the KGH Joint Planning Office, who provided guidance with the hospital floor plans. References [1] Sepkowitz K. Occupationally acquired infections in health care workers: part I. Ann Intern Med 1996;125(10):826-834. [2] Buxton Bridges C, Kuehnert MJ, Hall CB+. Transmission of Influenza: Implications for Control in Health Care Settings. Clin Infect Dis 2003;37:1094-1101. [3] Koh D, Aw T-C. Surveillance in Occupational Health. Occup Environ Med. 2003;60:705-10. [4] Centres for Disease Control. National Institute for Occupational Safety and Health. NIOSH Safety and Health Topic: Surveillance. http://www.cdc.gov/niosh/topics/surveillance/ (Accessed June 3, 2008). Further Information: Tara Donovan tdonovan@kflapublichealth.ca