Download
1 / 4
40 likes | 282 Views
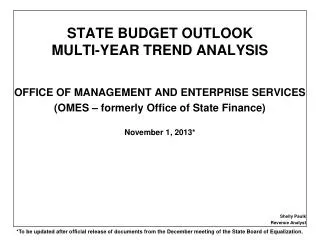
STATE BUDGET OUTLOOK MULTI-YEAR TREND ANALYSIS. OFFICE OF STATE FINANCE November 1, 2011* Shelly Paulk Revenue Analyst. *To be updated upon release of OSU Econometric Forecast in late November. GENERAL REVENUE TRENDS Income vs. Expenditures (In Millions). $5,969.3m. $5,916.4m.

E N D
STATE BUDGET OUTLOOKMULTI-YEAR TREND ANALYSIS OFFICE OF STATE FINANCE November 1, 2011* Shelly Paulk Revenue Analyst *To be updated upon release of OSU Econometric Forecast in late November.
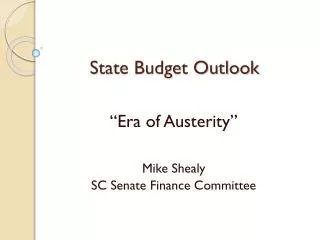
GENERAL REVENUE TRENDSIncome vs. Expenditures(In Millions) $5,969.3m $5,916.4m Actual Collections OFFICIAL ESTIMATE $5,759.2m ($104.3) $527.2 $429.1 $5,236.3 $772.8 $5,665.4m $267.9 $503 $621.3 $156.9 Appropriations Red line = Revenue trend line using actual average growth from FY-2004 thru FY-2011 – Ave. 3.1% Green line = Revenue trend line based on average growth (FY-1999 thru FY 2011) – Ave. 2.31% Black line = Expenditure growth adjusted for OHLAP (est. 8.22%) and ROADS increases (11 Session) Blue line = Average growth of appropriations, based on FY-2004 thru FY-2012 Act – Normalized Ave. 2.97% Revenue and expenditure growth rates are based on trends from OSF actual numbers and effects of current law.
General Revenue Fund SourcesTrend Based Projections, In Millions(TO BE UPDATED WITH OSU ECONOMETRIC FORECAST) FY-2012 – FY-2014 Ave.3.0% Growth Ave. 0.1% Growth Ave. 0.2% Growth Ave. 4.0% Growth Ave. 4.4% Growth OSF ACTUAL JUNE BOE EST 10-YEAR NORMALIZED TREND –BASED OSF PROJECTIONS SOURCES SHOWN ARE TOTALS – NOT REDUCED FOR OHLAP OR ROADS FUNDING, LESS DEFERRED GP TAX CREDITS, LESS INC TAX CHANGE
General Revenue Growth – 5 Major Sources(In Millions, With % of Change From Prior Year) (Total Growth: Personal Income Tax, Corporate Income Tax, Gross Production Gas, Sales Tax, Motor Vehicle Tax) (TO BE UPDATED WITH OSU ECONOMETRIC FORECAST) 5.4% 4.2% (6.7%) 4.4% 1.6% 2.8% 12.6% (17.3%) JUNE BOE ESTIMATE Based on OSF 10-Yr Normalized Trend-Based Projections Less Deferred GP Gas Tax Credits, Less Pers Inc Tax Rate Change ACTUALS OHLAP or ROADS Funding Not Removed