Download
1 / 1
10 likes | 106 Views
Observational Signatures of Atmospheric Velocity Fields in Main Sequence Stars F. Kupka 1,3 , J. D. Landstreet 2,3 , A. Sigut 2,3 , C. Bildfell 2 , A. Ford 2 , T. Officer 2 , J. Silaj 2 , A. Townshend 2 1 Max-Planck-Institut fur Astrophysik, Garching, Germany

E N D
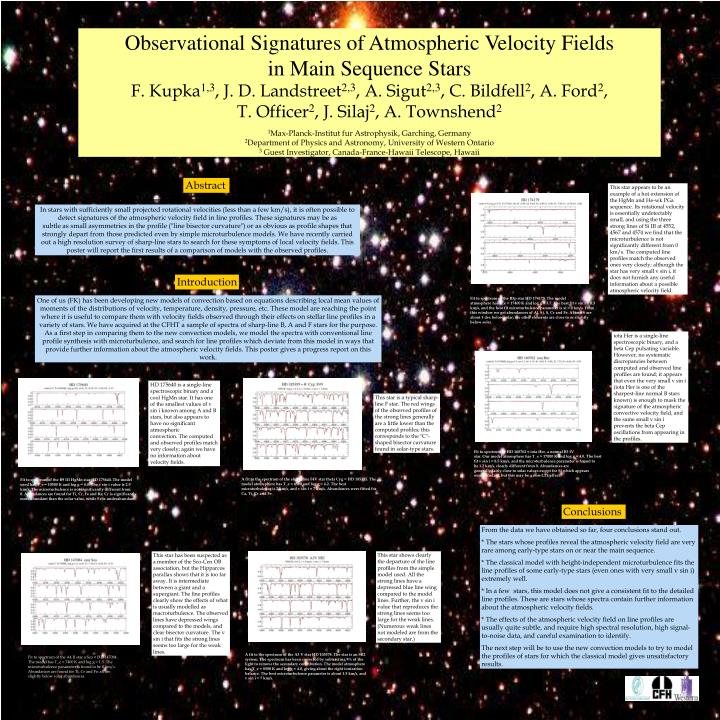
Observational Signatures of Atmospheric Velocity Fields in Main Sequence Stars F. Kupka1,3, J. D. Landstreet2,3, A. Sigut2,3, C. Bildfell2, A. Ford2, T. Officer2, J. Silaj2, A. Townshend2 1Max-Planck-Institut fur Astrophysik, Garching, Germany 2Department of Physics and Astronomy, University of Western Ontario 3 Guest Investigator, Canada-France-Hawaii Telescope, Hawaii Abstract This star appears to be an example of a hot extension of the HgMn and He-wk PGa sequence. Its rotational velocity is essentially undetectably small, and using the three strong lines of Si III at 4552, 4567 and 4574 we find that the microturbulence is not significantly different from 0 km/s. The computed line profiles match the observed ones very closely; although the star has very small v sin i, it does not furnish any useful information about a possible atmospheric velocity field. In stars with sufficiently small projected rotational velocities (less than a few km/s), it is often possible to detect signatures of the atmospheric velocity field in line profiles. These signatures may be as subtle as small asymmetries in the profile ("line bisector curvature") or as obvious as profile shapes that strongly depart from those predicted even by simple microturbulence models. We have recently carried out a high resolution survey of sharp-line stars to search for these symptoms of local velocity fields. This poster will report the first results of a comparison of models with the observed profiles. Introduction Fit to spectrum of the B3p star HD 174179. The model atmosphere has T_e = 17400 K and log g = 3.7. The best fit v sin i = 0.5 km/s, and the best fit microturbulence parameter is xi = 0 km/s. From this window we get abundances of Al, Si, S, Cr and Fe. Al and S are about 1 dex below solar; the other elements are close to or slightly below solar. One of us (FK) has been developing new models of convection based on equations describing local mean values of moments of the distributions of velocity, temperature, density, pressure, etc. These model are reaching the point where it is useful to compare them with velocity fields observed through their effects on stellar line profiles in a variety of stars. We have acquired at the CFHT a sample of spectra of sharp-line B, A and F stars for the purpose. As a first step in comparing them to the new convection models, we model the spectra with conventional line profile synthesis with microturbulence, and search for line profiles which deviate from this model in ways that provide further information about the atmospheric velocity fields. This poster gives a progress report on this work. iota Her is a single-line spectroscopic binary, and a beta Cep pulsating variable. However, no systematic discrepancies between computed and observed line profiles are found; it appears that even the very small v sin i (iota Her is one of the sharpest-line normal B stars known) is enough to mask the signature of the atmospheric convective velocity field, and the same small v sin i prevents the beta Cep oscillations from appearing in the profiles. HD 175640 is a single-line spectroscopic binary and a cool HgMn star. It has one of the smallest values of v sin i known among A and B stars, but also appears to have no significant atmospheric convection. The computed and observed profiles match very closely; again we have no information about velocity fields. This star is a typical sharp-line F star. The red wings of the observed profiles of the strong lines generally are a little lower than the computed profiles; this corresponds to the "C"-shaped bisector curvature found in solar-type stars. Fit to spectrum of HD 160762 = iota Her, a normal B3 IV star. Our model atmosphere has T_e = 17000 K and log g = 4.0. The best fit v sin i = 8.5 km/s, and the microturbulence parameter is found to be 1.2 km/s, clearly different from 0. Abundances are generally fairly close to solar values except for Si which appears overabundant, but this may be a non-LTE effect. A fit to the spectrum of the sharp-line F4V star theta Cyg = HD 185395. The model atmosphere has T_e = 6500 and log g = 4.2. The best microturbulence is 2 km/s, and v sin i = 7 km/s. Abundances were fitted for Ca, Ti, Cr and Fe. Fit to spectrum of the B9 III HgMn star HD 175640. The model used has T_e = 10500 K and log g = 4.0. The v sin i value is 2.9 km/s. The microturbulence is not significantly different from 0. Abundances are found for Ti, Cr, Fe and Ba; Cr is significantly more abundant than the solar value, while Fe is underabundant. Conclusions From the data we have obtained so far, four conclusions stand out. * The stars whose profiles reveal the atmospheric velocity field are very rare among early-type stars on or near the main sequence. * The classical model with height-independent microturbulence fits the line profiles of some early-type stars (even ones with very small v sin i) extremely well. * In a few stars, this model does not give a consistent fit to the detailed line profiles. These are stars whose spectra contain further information about the atmospheric velocity fields. * The effects of the atmospheric velocity field on line profiles are usually quite subtle, and require high spectral resolution, high signal-to-noise data, and careful examination to identify. The next step will be to use the new convection models to try to model the profiles of stars for which the classical model gives unsatisfactory results. This star shows clearly the departure of the line profiles from the simple model used. All the strong lines have a depressed blue line wing compared to the model lines. Further, the v sin i value that reproduces the strong lines seems too large for the weak lines. (Numerous weak lines not modeled are from the secondary star.) This star has been suspected as a member of the Sco-Cen OB association, but the Hipparcos parallax shows that it is too far away. It is intermediate between a giant and a supergiant. The line profiles clearly show the effects of what is usually modelled as macroturbulence. The observed lines have depressed wings compared to the models, and clear bisector curvature. The v sin i that fits the strong lines seems too large for the weak lines. A fit to the spectrum of the A3 V star HD 103578. The star is an SB2 system. The spectrum has been corrected by subtracting 9% of the light to remove the secondary contribution. The model atmosphere has T_e = 8500 K and log g = 4.0, giving about the right ionization balance. The best microturbulence parameter is about 1.5 km/s, and v sin i = 7 km/s. Fit to spectrum of the A4 II star o Sco = HD 147084. The model has T_e = 7400 K and log g = 1.5. The microturbulence parameter is found to be 0 km/s. Abundances are found for Ti, Cr and Fe; all are slightly below solar abundances.