Download
1 / 64
640 likes | 642 Views
This article discusses the interpretation and test results of the SAFNWC/MSG program package products used by the Hungarian Meteorological Service. It includes information on the data sources, visualization tools, and applications of the SAFNWC products. Additionally, it explores the testing process and specific case studies.

E N D
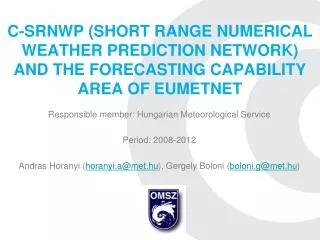
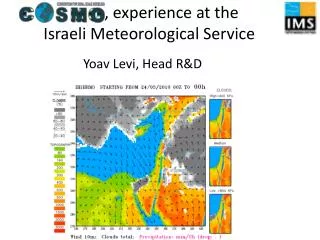
Experiences on the interpretation and some test results of the SAFNWC/MSG program package products at the Hungarian Meteorological Service Putsay M., Diószeghy M., Kolláth K., Kertész S., Rajnai M., Szenyán I. and Kerényi J. Hungarian Meteorological Service SAFNWC PAR Workshop Madrid
Hungarian Meteorological Service – early user of the SAFNWC/MSG program package as a beta tester, and since then we are running the actual version of the program package. The SEVIRI data are received by Kongsberg system. (HRIT slots) ECMWF fields are used as NWP data, in every 3 hours with 0.5 x 0.5 degree spatial resolution up to 10hPa Region Central European (640x480 pixel) Now we run the 1.2 version and produce all products operationally.
Some of the products are operationally sent for the duty forecasters From CMa and CT a cloud amount image is calculated x
HAWKHungarian Advanced Weather worKstation software • Tool for visualization (developed in Hungary) for the duty forecasters • NWP fields • SYNOP and automatic weather station measurements • Radar data • Satellite data NOAA, METEOSAT, MSG • MSG single channels, composite images, SAFNWC products • Radisonde data • Lightning data • etc
MEANDERsoftware • Mesoscale Analysis, Nowcasting and Decision Routines • An automatic nowcasting system for helping the work of the duty forecasters developed for nowcasting purposes. • radiosonde, • synop and automatic weather station measurements, • mesoscale numerical model outputs, • radar, • satellite images, • lightning data. • Satellite based input parameters • cloudiness, cloud top height and cloud types, • earlier calculated from METEOSAT data, • already replaced with the new SAFNWC/MSG outputs (CMa, CT, CTTH). • it could use other SAFNWC products as well.
An automatic warning dispatch system is part of the MEANDER service. • It is used by the forecasters to create and manage warning conditions: • the presence of certain values, or • if the value of a variable in the specified geographical area falls into a specified interval. • If warning conditions are met: • e-mails are sent • Warning events are archived. • The SAFNWC CT product (together with derived low visibility) is also used to send warning of potential night-time fog.
Applications of SAFNWC products • Visualization for forecasters • input in a Nowcasting program • Investigation of case studies But before Testing of SAFNWC products Both satellite meteorologists and forecasters test the SAFNWC products. Case studies are investigated and for some products statistics are calculated.
Rapid Developing Thunderstorms We think this product would be useful for forecasters We would use it visualizing for forecasters (and for satellite researchers) in programs as input data -- nowcasting program other application (I have already used it by both ways (looking and in program) in verification of CRR.) RDT could be an input data in an automatic software (MEANDER) developed for nowcasting purposes. There is a thunderstorm module in it, and the additional information from RDT could increase the quality of this module.
IR10.8 RDT 2005. 06.25. 18:15
Difficult to visualize it -- complicated • Difficult to check the visualization (output file) • Lightning data only for Hungary • Webpage of the developers - real time demo for Europe • http://www.meteo.fr/special/PI/OPIC/Europe/index.htm • It is difficult to compare with the webpage of the developers • Lightning data as input (for some area one can not know whether it was used lightening data or not) • (I should not have ‘additional’ cells) • They do not use the same software/same input SEVIRI data (not HRIT slot) • One can not save the image, nor look the previous ones • RDT output on Help Desk • Only for Spain, a part of France • Lightning data is used, but not indicated where it was • Retrieved parameters are not seen
First we run RDT without lightning data (optional input) We were not satisfied with the results, but we did not know the reason • There is some mistake in the visualization • Or because we do not use lightning data, maybe the algorithm needed more the lightning data than I supposed Later we added lightning data, but we have lightning data only for Hungary and a part of Slovenia Why were we not satisfied?
Without lightning data It does not detect all convective cells, thunderstorms, sometimes neither the very marked typical Cb, or only rather late in its life cycle. (And sometimes it tracks a very uninterested cloud during 2-3 hours.)
It does not detect every convective cell. RGB14r9 RDT 2005.06.29. 07:15
It does not detect every convective cell. RGB14r9 RDT 2005.06.29. 08:15
It does not detect every convective cell. RDT with ASII-NWP RGB14r9 RDT 2005.09.28. 13:15
Misdetections RDT often detects Ci as convective cloud Only 1 channel data is used We think the result would be better if they used more channel data (Tb10.8-TB12.0), (Tb10.8-TB8.7) and/or CT product for example to separate semitransparent clouds…
Ci clouds RGB321 RDT 2005.09.28. 10:00
Ci clouds RGB321 RDT 2005.09.29. 09:15
RGB14r9 RDT 2005.06.24. 14:30 Ci anvil
Misdetections Part of a front Low water clouds Fog Huge area which are not on the real time demo
It does not detect every convective cell. RDT with ASII-NWP RGB14r9 RDT 2005.09.28. 13:15
fog RGB321 RDT 2005.09.27. 07:15
fog CT RDT 2005.09.27. 07:15
We tried to compare with the webpage of the developers and big differences were found, not only because of using the lightning data. • We made RDT comparison for some cases with Paul de Valk, Netherlands. • Similar platform: Sun Solaris • Same input: • HRIT slots • same NWP data (needed for CTTH) • ECMWF 3 hours 0.5 x 0.5 degree spatial resolution up to 10hPa • same model config file • The regions are different but we have quite big common region. • He uses lightning data for Netherlands and I use for Hungary, • but I compared only the clouds detected without lightning data.
He sent me the bufr file. • I converted his and my buf files to hdf5 file, • I visualized theme with our software. • I wrote the characteristics for the clouds with nature=0 in a text file. • We should have the same results (except the lightning clouds.) • Experiences of the comparisons: • There are differences between our outputs. • I compared: • 20051003 09:00 • 20050929 09:00 • 20050928 10:00 • 20050927 07:15 • 20050615 16:45
20050615 16:45 On the region of interest many clouds were detected by both of us But there are some clouds detected only by himand some others detected only by me. The system directions are different, but other characteristics are EXACTLY the same.
20050929 09:00 The results were similar. Paul de Valk had 2 clouds which I did not have. For the common clouds the system direction were different. for 20051003 09:00 On the region of interest all cells were detected by both of us. The characteristics were the same, except the system direction. 20050927 07:15On the common area I had 1 cell, Paul de Valk had no cell. 20050928 10:00 The results were totally different. We had no common system detected! I had one cell, which was detected by me, but not by Paul de Valk. Paul had 3 such cells. (( There were clouds over Netherlands detected by him with lightning, But I had not these clouds using only IR data.))
Why sometimes KNMI detects a cloud not picked up by me and vice versa? • for 20050615 the KNMI results are always higher than the Hungarian ones.for 20050929 the KNMI results are again higher but the absolute difference is lessIs there an explanation for this?
It is not due to a programic error It is due to the different region. Discrimination depends on the life age If it is near to the boundary of my region and far from the boundary of his region then it may be ‘young’ for me and ‘old’ for him so other discrimination algorithm would be used. Does it mean that we should use much bigger region and trust only the ‘inner’ part? Maybe the reason that we found big differences with real time demo is not only that we do not have lightning data but also we use not enough big region, or same area should be masked.
RDT gives much better results with lightning data, • but many users have not lightning data for a ‘big’ area. • How big region to run RDT for? • Only for a region, where we have lightning data? Just for the country? • A huge region being far from the boundaries? • Does RDT gives better/other information then an image overlaid by lightning data? • It gives additional information • cooling rate • expanded rate • speed of expectable movement. • But if the detection has many problems (misdetection and not detection) then the advantages can ‘dissolve’. • Then maybe a good composite image overlaid by lightning data is more reliable.
Difficult to check the visualization (output file) • A webpage is needed -- outputs for Europe • Which uses the same SAFNWC/MSG program, same HRIT slot inputs • Output without lightning data !!!!!!!!!!!!!!!!!!!!!!!!!!!!!!!!!!!! • Possibility of saving the image and looking the previous ones as well • Output with lightning data
At night Embedded cell RGB_night RDT ASII-NWP 2005.06.23. 00:45UTC
Cloud Mask CMa, Cloud type CT, Cloud top temperature, pressure and height CTTH
We visualize CMa, CT and CTTH products for the duty forecasters since August 2004 (from May 2005 the v1.2) (From CMa and CT a cloudiness image is calculated and visualized for forecasters) CMa, CT and CTTH were integrated in MEANDER since November 2004. input parameters in a program The forecasters can use it also in the automatic warning system (PC + derived low visibility) to detect potentially night time fog Aviation meteorologist use CTTH to estimate the cloud top height Radar and/or CTTH, surface observations
From CMa and CT we perform ‘cloud amount image’ and visualize it. We use mainly CT (more elaborated algorithm) Cloud amount in octa, 5x5pixel mean
CMa 04.11.2004. 10:00UTC Cloud amount snow cloudy partly cloudy CT RGB14r9
CT 04.11.2004. 10:00UTC Cloud top pres. cloud top hight Cloud top temp.
SAFNWC CT Cloud type 2004.10.20. 02:00
RGB_night 2004.10.20. 02:00
No inversion inversion Nig ht Twilight day night Twilight day % 83 71 95 66 58 91 We compared the SAFNWC CMa product with the SYNOP observations. 2 months data from middle of September to middle of November 2004. The following table shows the per cent values when the CMA product give cloudy/partly cloudy for the cases reported as fog by the SYNOP.
Our forecasters use regularly the CT productand find it very useful! feed back, questions when something is wrong. at winter nighttime (high season for fogs and temperature inversion) v1.1 incoherency between CT and CTTH may happen (one shows low, other shows medium cloud)
Limitations • problems with fog/low cloud detection at twilight • at visualization • The forecasters know about this problem • They look animation, composite images may help RGB_night • for the input in a program • It is more difficult to handle this problem. • problems with fog/low cloud detection under thin Ci • at visualization • composite images may help
Requirements of forecasters and of the developer of the MEANDER software • Dreams • SEPARATE FOG FROM LOW CLOUDS. • Separate fog/stratus from stratocumulus • Separate Cb from opaque high-very high clouds • For aviation meteorologists, it is very important to separate the fog/low stratus from other clouds like stratocumulus. • -- to introduce a new thresholdat about 925hPa to split the class 6. • -- the separation of cumuliform and layer clouds
Probability of precipitation PC Convective rain rate CRR
Visiting Scientist Activity (Associated Scientist, 5 months) Validation the SAFNWC/MSGv1.2precipitation products: PC and CRR 2.5 months summer data (13.06.2005-04.09.2005). · The TB data set and the results are delivered for the developers to help the tuning.