Download
1 / 39
390 likes | 476 Views
Why did we want profiles of gas and particle concentrations during AOE-2001?. IAOE-91 and AOE-96 showed unexpectedly large changes of trace gases and particles near surface, occurring on time scale of minutes to hours, sometimes exceeding the entire seasonal variation. AOE-96. Julian Day.

E N D
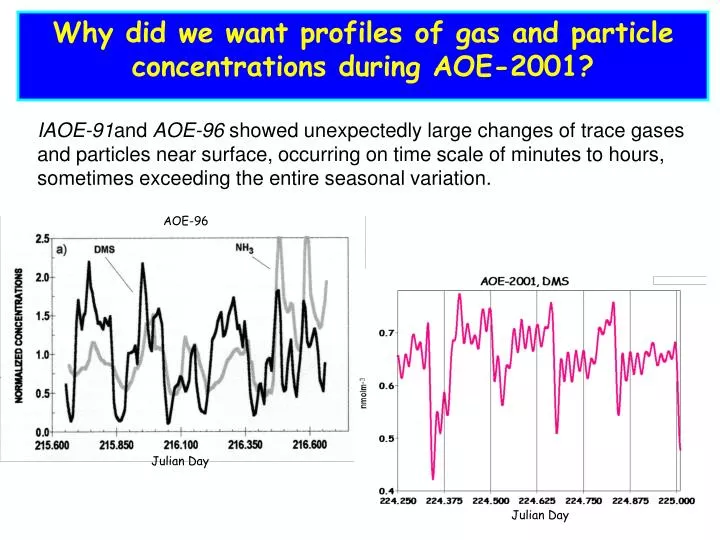
Why did we want profiles of gas and particle concentrations during AOE-2001? IAOE-91and AOE-96 showed unexpectedly large changes of trace gases and particles near surface, occurring on time scale of minutes to hours, sometimes exceeding the entire seasonal variation. AOE-96 Julian Day Julian Day
Free Troposphere Stratucumulus Well-Mixed Marine Boundary Layer Ocean Possible reasons: Change of air mass IAOE-91 Radon Aitken mode DMS
Possible reasons: Change of air mass Did only accounted for some of the changes!
Possible reasons: Mixing to the surface of air having different concentrations AOE-96
Possible causes of a vertical tracer gradient:Air trajectories and hence source and sink processes, changing with height of arrival AOE-96 AOE-2001
Possible causes of a vertical tracer gradient:Losses of aerosols due to clouds
Cloudy Sc Sc Cold Ocean Possible causes of a vertical tracer gradient:Losses of aerosols due to clouds Accumulation Mode
Possible causes of a vertical tracer gradient:Local sources of aerosol Is there a significant local source of aerosol through new particle formation? If so, where does it come from? Is there a significant source of primary aerosol from the sea surface? Cloud-free Stratified Aerosol Layers Cold Ocean
Cloudy Sc Sc Cold Ocean Possible causes of a vertical tracer gradient:Local sources of aerosol above cloud/fog top Nuclei Mode Accumulation Mode
Sc Cold Ocean Possible causes of a vertical tracer gradient:A limited number of aerosol profiles showed very considerable layering of aerosols, even within the supposedly well-mixed boundary layer. What was the cause of this layering? Well-Mixed Boundary Layer Particle concentration, cm-3
Cloudy Cloud-free Sc Stratified Aerosol Layers Sc Cold Ocean Climate consequences of a vertical tracer gradient: The common stratifacation of aerosols/gases shows that the application of ship based measurements to project low-level stratocumulus properties and consequently their radiative proporties is critically dependent on mixing between the layers and the surface, which is not well understood
Balloon (Univ. Colorado) • Vertical Profiling • Meteorology • FLuxes • Particles
Inlet for aerosols and gases • Helicopter • Vertikal profiling • Gases (PTR-MS, Univ. Innsbruck) • Particles(Univ. Lund, Stockholm)
#11-18 #19 #10 #20-34 #35,36 #9 #4,5 #8 #3 #1,2 #7 Heli-profiling #6
Heli-profiling during the Ice Drift #20 #21-24 #25 #26,27 #28 #29,30,31 #32 #33,34
CPC UCPC OPC Pump Aerosol inlet Aerosol rack
AOE-2001 Helicopter Aerosol System Aerosol Instrumentation Rack PC TSI UCPC 3025: Dp > 3 nm TSI CPC 3760A: Dp > 15 nm CLIMET OPC CI500: Dp > 300 nm CPC UCPC OPC Pump Aerosol inlet Isokinetic at 70 km/h
Aerosol inlet Gas inlet
AOE-2001 Helicopter Aerosol System Aerosol instrumentation only Data acquisition card (EDAS-1001E) Serial 3 Pulses, 15V, 0.5 µs Pulses, 13V, 3.3 µs p=0.5x atm. pressure 15 1.0 1.0 CPC >15nm 1.5 UCPC >3nm OPC >300nm Serial 3 Aerosol inlet Isokinetic 2.83
AOE-2001 Helicopter Aerosol System Complete system RH, p, T Serial 1 CPC >15nm (Pulses, 15V, 0.5 µs) GPS Serial 2 (Pulses, 13V, 3.3 µs) Data acquisition card (EDAS-1001E-1A) UCPC >3nm (via network card) (RJ45 connectors) OPC >300nm Serial 3
Some suggested workshop topics (I): • What are the meteorological conditions that lead to exchange of air between the free troposphere and sub-cloud air? • Can we project from the meteorology when an exchange has occurred along the backward air trajectory? • Can the projection be verified by changes in trace gas concentration? • What proportion of free tropospheric air is found near the surface following an interchange? • What is the frequency of such interchanges? • Can we use changes in water vapor or other gas levels, or potential temperature as a guide to 5?
Some suggested workshop topics(II): • Are the radiative properties of the lower clouds likely to have a significant influence on regional radiation balance? How often were they overlaid by higher cloud decks? • Suppose new particle formation occurs just below cloud base or the lowest inversion. How long will it take the particles to diffuse to the measurement height under various stability conditions? • Suppose the open leads emit a steady stream of particles that have negligible fall velocity. What would concentration profiles look like within the boundary layer under the range of stability conditions encountered?
Cloud of nuclei particles below 200 m altitude. Very sharp border. Some suggested workshop topics(III): • Spatial and temporal uniformity of profiles. Comparison of Mike’s fixed site measurements with heli profiles at or near he same time. • What is the horisontal extent of a “particle cloud”?
Some suggested workshop topics(VI): • Why do layers of particles <15nm often seem to occur just below or even within layers of particles >300nm? • Relation of particle concentration in different size ranges to regions previously occupied by cloud or fog? • How to solve deficiencies in Heli- T, RH • What are the conclusions from A-01 profiling? What remains to be established that is important from a climate change perspective? What would be needed to do it?
Mid-latidue In middle latitudes the cloud-topped marine boundary layer is generally capped by an increase in temperature (e.q, a temperature inversion) and a decrease in dew-point. Arctic The Arctic is unusual in that quite frequently both temperature and humidity increase with height over distances of several hundreds of meters above the tops of low-level stratus clouds .
Arctic Twenty-seven of 47 profiles were characterized by increases in hu-midity over distances of several hundred meters just above the cloud-topped boundary layer, with the water-vapor mixing ratio ;1–2 g kg-1 higher within these re-gions than in the boundary layer. In each of these 27 cases, there was a significant increase in Aitken nucleus concentrations within the zone of high humidity.
Wm Aitken Mode Temp. Accumulation Mode
Aitken Mode Wm Accumulation Mode Temp.
Temp. Aitken Mode Wm Accumulation Mode