Download
1 / 22
220 likes | 382 Views
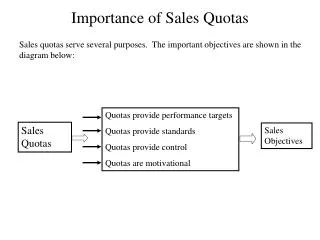
QUOTAS OF THE MEMBER STATES. TRADITIONAL METHODOLOGY COMPUTATION, DRAWBACKS AND ALTERNATIVES. QUOTAS -TRADITIONAL METHOD. The Traditional Method is the simplest approach to compute a scale of quota assessments

E N D
QUOTAS OF THE MEMBER STATES TRADITIONAL METHODOLOGY COMPUTATION, DRAWBACKS AND ALTERNATIVES
QUOTAS -TRADITIONAL METHOD • The Traditional Method is the simplest approach to compute a scale of quota assessments • However, it results in a scale that, under present circumstances, does not strictly adhere to the “ability to pay” principle
QUOTAS -TRADITIONAL METHOD • The methodology consists of three steps: • Establish a maximum quota of 59.47% (United States) • Establish a minimum quota of 0.020% for those member states who pay the minimum quota at the UN (0.001% which applies to 8 OAS member states) • Multiply the UN quota of the remaining 26 member states, whose aggregate UN quota is 8.149%, by a factor of 4.954* The minimum and maximum quotas are set by agreement among the member states *See Annex I for calculation of this factor
QUOTAS -TRADITIONAL METHOD The scale adds up to 100% United States 59.470% 8 member states paying minimum at UN (8 x 0.020) 0.160 Remaining 26 member states (8.149 x 4.954) 40.370 Total: 100.000%
TRADITIONAL METHODSHORTCOMINGS • The problem with this approach is that it would result in calculated quotas that are below the agreed-upon minimum of 0.020%. (See Annex II) • St. Lucia, for example, has a UN quota of 0.002%. Multiplying it by the correction factor of 4.954 would yield a quota of 0.010% • Similar results are obtained when the factor is applied to Antigua and Barbuda and Haiti, whose UN quota is 0.003%, yielding an OAS quota of 0.015%
TRADITIONAL METHODSHORTCOMINGS • This situation could be remedied by applying the minimum quota of 0.020% to St. Lucia, Antigua and Barbuda, and Haiti. • The difference in percentage points would be redistributed among the remaining 23 member states (see Annex III for results)
TRADITIONAL METHODSHORTCOMINGS However, the methodology would yield undesirable results: • St. Lucia, which pays twice as much as 8 other member states at the UN, would pay the same quota at the OAS. • The same situation would apply to Antigua and Barbuda and Haiti, which pay three times as much as 8 other member states and 50% more than St. Lucia This would, in essence, violate the “ability to pay” principle set forth in Article 55 of the OAS charter
TRADITIONAL METHODALTERNATIVES • The traditional methodology is essentially a “linear”, or constant-proportionality, calculation. As we have established, it is not appropriate for the calculation of OAS scales, given current UN quotas. • The next alternative is an exponential relationship of the form: Y = aXb + c Where: Y = OAS quota X = UN quota, and a, b, and c are parameters to be determined using optimization methods (see Annex IV for an example of the resulting scale) • This solution yields a scale that reflects the UN rankings and meets the constraints of minimum and maximum quotas
ALTERNATIVE METHODY = aXb + c • This methodology was first proposed in 1998, along with another variation thereof. • The member states were unsuccessful in reaching an agreement on a quota scale based on any of the alternative methodologies presented. • In 2000, a more sophisticated approach was first proposed, using logistic regression as the basis for a new mathematical formula. This is the latest methodology presented to the CAAP for consideration
ANNEX ITRADITIONAL METHOD • The following charts describe the step-by-step calculation of the scale using the traditional method
ANNEX IIResulting ScaleTraditional Method • The scale that results from applying the traditional methodology yields quotas for three member states that are below the minimum, 0.020% • The reason for this is that the minimum OAS quota is 10 times greater than that of St. Lucia, and 6.67 times greater than those of Antigua and Barbuda and Haiti, but the proportional rate applied is only 4.954. • Note that the mathematical relation applied preserves the UN rankings of the member states; that is, the quota for Antigua and Barbuda is the same as Haiti’s, and these are still greater than that of St. Lucia
ANNEX IIIResulting ScaleTraditional Method w/Correction • The scale should be corrected by enforcing the minimum quota on those countries whose calculated quota falls below 0.020%. • However, these member states are paying the same quota at the OAS as those who pay the minimum at the UN, resulting in a deviation from the “ability to pay” principle. • For example, Haiti pays 3 times as much as Suriname at the UN, but both countries would pay the same quota at the OAS • This distortion renders the traditional methodology unusable for our purposes, given current UN scales.
ANNEX IVAlternative Method • The next alternative methodology would be to use an exponential relationship of the form: Y = aXb + c Where: X = UN quota Y = OAS quota a = 5.0891 b = 0.795326 c = -0.00092487 This solution yields a scale that reflects the UN rankings and meets the constraints of minimum and maximum quotas