Download
1 / 1
10 likes | 30 Views
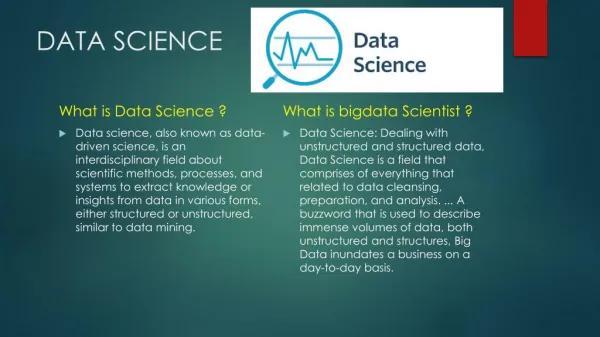
DATA SCIENCEBecome a Data Scientist from RStrainings. Business Analytics is a specialized course designed to deliver knowledge on application of statistical concepts in real world scenarios. This course is designed to equip professionals working in Finance, Marketing, Economics, Statistics, Mathematics, Computer Science, IT, Analytics, Marketing Research, or Commodity markets with the essential tools, techniques and skills to answer important business

E N D
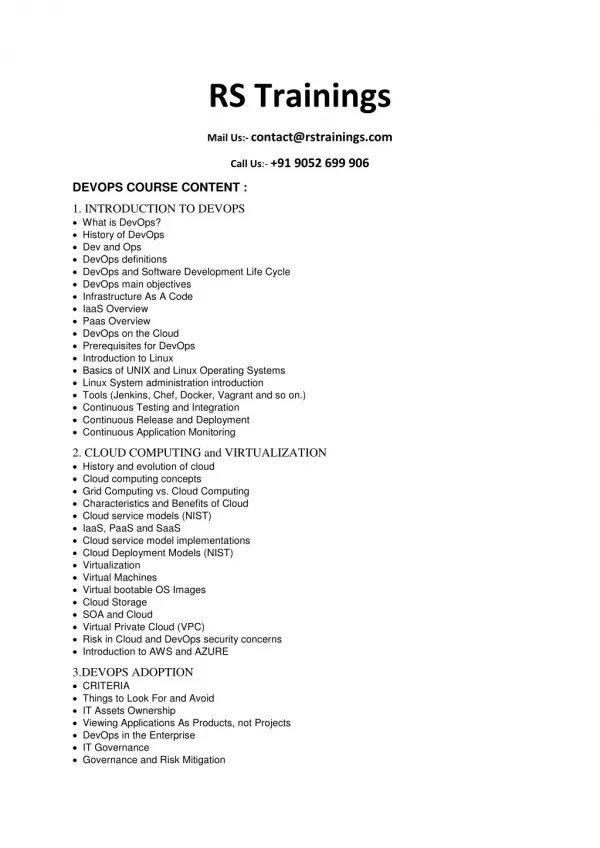
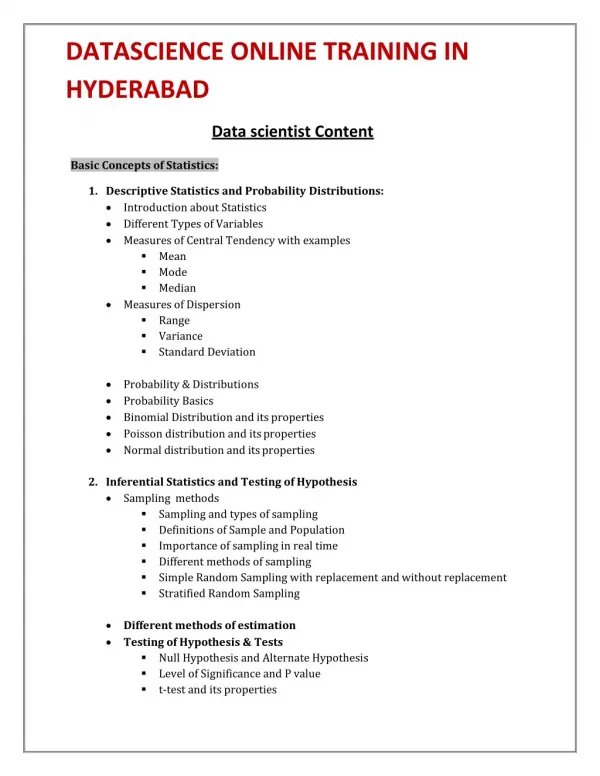
DATA SCIENCE ONLINE TRAINING IN HYDERABAD DATA SCIENCE ONLINE TRAINING Data Science Introduction and Toolbox Getting Started with Github Introduction to Git Introduction to Github Creating a Github Repository Basic Git Commands Basic Markdown Getting Started with R Overview of R R data types and Objects Getting Data In and Out of R Subsetting R Objects Dates and Times Control structures Functions Scoping rules of R Coding Standards for R Dates and times Loop Functions Vectorizing a Function Debugging Profiling R Code Simulation Data Extraction, Preparation and Manipulation ( R, MYSQL, HDFS, HIVE and SQOOP) Data Extraction Downloading Files Reading Local Files Reading Excel Files Reading JSON Reading XML Reading From WEB Reading From API Reading From HDFS Reading From MYSQL SQOOP Reading FROM HIVE Saving and Transporting Object Reading Complex Structure Data Preparation Subsetting and Sorting Summarizing Data Creating New Variable Regular Expression Working With Dates Data Manipulation Managing DataFrame with dplyr package Reshaping Data Merging Data Descriptive Statistics Univariate Data and Bivariate Data Categorical and Numerical Data Frequency Histogram and Bar Charts Summarizing Statistical Data Box Plot, Scatter Plot, Bar Plot, Pie Chart Probability Conditional Probability Bayes Rule Probability Distribution Correlation vs Causation Average Variance Outliers Statistical Distribution Binomial Distribution Central Limit Theorem Normal Distribution 68-95-99.7 % Rule Relationship Between Binomial and Normal Distribution Hypothesis Testing Hypothesis Testing Case Studies Inferential Statistics Testing of Hypothesis Level of Significance Comparison Between Sample Mean and Population Mean z- Test t- Test ANOVA (f- Test) ANCOVA MANOVA MANCOVA Regression and Correlation Regression Correlation CHI-SQUARE Principal Of Analytic Graph Introduction to ggvis Exploratory and Explainatory Design Principle Load ggvis and start to explore Plotting System in R ggvis - graphics grammar Lines and Syntax Properties for Lines Properties for Points Display Model Fits Transformations ggvis and dplyr HTMLWIDGET Geo-Spatial Map Time Series Chart Network Node Predictive Models and Machine Learning Algorithm - Supervised Regression Regression Analysis Linear Regression Non- Linear Regression Polynomial Regression Curvilinear Regression Multiple Linear Regression Collect Data Explore and Prepare the data Train a model on the data Evaluate Model Performance Improve Model Performance Logistic Regression Collect Data Explore and Prepare the data Train a model on the data Evaluate Model Performance Improve Model Performance Time Series Forecast Collect Data Explore and Prepare the data Train a model on the data Evaluate Model Performance Improve Model Performance Predictive Models and Machine Learning Algorithm - Supervised Classification Naïve Bayes Linear Regression Non- Linear Regression Polynomial Regression Curvilinear Regression Support Vector Machine Collect Data Explore and Prepare the data Train a model on the data Evaluate Model Performance Improve Model Performance Random Forest Collect Data Explore and Prepare the data Train a model on the data Evaluate Model Performance Improve Model Performance K- Nearest Neighbors Collect Data Explore and Prepare the data Train a model on the data Evaluate Model Performance Improve Model Performance Classification and Regression Tree (CART) Collect Data Explore and Prepare the data Train a model on the data Evaluate Model Performance Improve Model Performance Predictive Models and Machine Learning Algorithm - Unsupervised K Mean Cluster Linear Regression Non- Linear Regression Polynomial Regression Curvilinear Regression Apriori Algorithm Collect Data Explore and Prepare the data Train a model on the data Evaluate Model Performance Improve Model Performance Case Study : Customer Analytic - Customer Lifetime Value Collect Data Explore and Prepare the data Train a model on the data Evaluate Model Performance Improve Model Performance Text Mining, Natural Language Processing and Social Network Analysis Natural Language Processing Collect Data Explore and Prepare the data Train a model on the data Evaluate Model Performance Improve Model Performance Social Network Analysis Collect Data Explore and Prepare the data Train a model on the data Evaluate Model Performance Improve Model Performance Capstone Project Saving R Script Scheduling R Script