Download

1 / 8

E N D
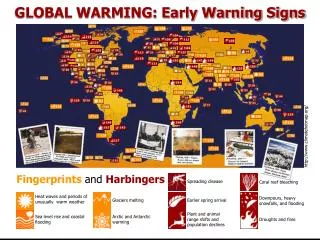
Global warming is increasing the average temperature of the global ocean and the atmosphere of the Earth, which is observed from the 1950s onwards. [1] Often synonymous with global warming using climate period 1906-2005 there was an increase in the average global temperature near the earth's surface with an average (0,74 ± 0,18) ° C. Official opinion of the Intergovernmental Framework on Climate Change of the United Nations (IPCC - Intergovernmental Panel on Climate Change) is that " the majority of the observed from the mid-20th century increase in global average temperatures very likely due to the observed increase in anthropogenic greenhouse gas concentrations gases " . While a number of researchers disagree with some conclusions of the IPCC, cording to official information from the same organization the vast majority of scientists working on climate change, agree with the main conclusions . .
The evidence for warming of the climate system includes observed increases in global average air temperatures and ocean waters, widespread melting of snow and ice and rising global average sea level. [9 ] [10] [11] linear interpolation global average surface temperature increased to 0,74 ± 0,18 ° C for the period 1906 to 2005 year , the rate of heating during the second half of this period is almost two times higher than the average for the whole period (0,13 ± 0,03 ° C decade against 0,07 ± 0,02 ° C per decade ) . In these figures the effect of urban heat islands is very small , estimated at less than 0,002 ° C per decade since the early 20th century. [12] According to satellite temperature measurements after 1979 the temperature of the lower troposphere increases by between 0 , 13 and 0,22 ° C per decade . Indirect evidence suggests that temperature for ten centuries before 1850 is relatively stable , with regional variations , such as the Medieval climate optimum and the Little Ice Age. [13]Estimates of the Space Research Institute " Goddard " and the National Climatic Data Center show that 2005 and 2010 were the warmest years since reliable mass measurements in the late 19th century, ahead of 1998 with a few hundredths of a degree . at the same time, according to estimates by the Center for climatic Research , 2005 was the second warmest year after 1998 and before 2003 and 2010, which ranked third , although "an error for the years .. . is at least ten times greater than the differences between these three years. " According to the World Meteorological Organization nominal value of 2010 is +0,53 ° C, greater than about 2005 (+0,52 ° C) and 1998 (+0,51 ° C) year, although " differences were not statistically significant " . temperatures in 1998 were unusually high because the strongest manifestation of the fluctuation of the century El Niño .
Videos Video 1-http://video.nationalgeographic.com/video/environment/global-warming-environment/global-warming-101/ Video 2-http://www.youtube.com/watch?v=ab6jV4VBWZE
what is the cause of global warming CO2 survives in the atmosphere for a long time—up to many centuries—so its heat-trapping effects are compounded over time. Of the many heat-trapping gases, CO2 puts us at the greatest risk of irreversible changes if it continues to accumulate unabated in the atmosphere—as it is likely to do if the global economy remains dependent on fossil fuels for its energy needs. To put this in perspective, the carbon we put in the atmosphere today will literally determine not only our climate future but that of future generations as well. Substantial scientific evidence indicates that an increase in the global average temperature of more than 3.6 degrees Fahrenheit (°F) (or 2 degrees Celsius [°C]) above pre-industrial levels poses severe risks to natural systems and to human health and well-being. The good news is that, because we as humans caused global warming, we can also do something about it. To avoid this level of warming, large emitters such as the United States need to greatly reduce heat-trapping gas emissions by mid century. Delay in taking such action means the prospect of much steeper cuts later if there is any hope of staying below the 3.6°F (2°C) temperature goal. Delayed action is also likely to make it more difficult and costly to not only make these reductions, but also address the climate consequences that occur in the meantime.