Download
1 / 45
450 likes | 593 Views
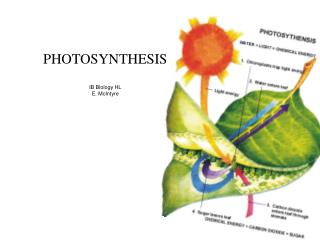
Chapter 10: Photosynthesis. (b). Multicellular alga. (c). Unicellular protists. (e). Purple sulfur bacteria. Figure 10.2. (a) Plants. (d) Cyanobacteria. 40 m. 10 m. 1 m. Sunlight energy. ECOSYSTEM. Photosynthesis in chloroplasts. CO 2. Glucose. H 2 O. O 2.

E N D
Chapter 10: Photosynthesis
(b) Multicellularalga (c) Unicellularprotists (e) Purple sulfurbacteria Figure 10.2 (a) Plants (d) Cyanobacteria 40 m 10 m 1 m
Sunlight energy ECOSYSTEM Photosynthesis in chloroplasts CO2 Glucose H2O O2 Cellular respiration in mitochondria ATP (for cellular work) Heat energy What we (should) already know!
Plants are producers • Autotrophs – make their own organic molecules from inorganic carbon (CO2) • Photoautotrophs – use light to make organic molecules • Heterotrophs - obtain organic molecules from another organism • Consumers • Decomposers
Leaf cross section Chloroplasts Vein Mesophyll Figure 10.4a Leaf Structure Stomata CO2 O2 Chloroplast Mesophyllcell 20 m
Chloroplast Figure 10.4b Outermembrane Chloroplasts Thylakoid Intermembranespace Granum Stroma Thylakoidspace Innermembrane 1 m
Photosynthesis Figure 10.5 Reactants: 6 CO2 12 H2O 6 H2O Products: C6H12O6 6 O2
Tracer Experiment • Used radiolabeled oxygen atoms in the reactants to determine which contributed the O2 that is released by plants • Could be from CO2 or H2O
Oxidation-Reduction Reactions (Redox) • Occurs when electrons are moved from one molecule to another • The molecule that loses the electron(s) is OXIDIZED (called oxidation) • The molecule that gains the electron(s) is REDUCED (called reductions) • They will always go together • As electrons move, they gain potential energy (in photosynthesis) • In photosynthesis, electrons move from water to CO2, forming sugars
Photosynthesis is a Redox Reaction Figure 10.UN01 becomes reduced C6 H12 O6 6 O2 Energy 6 CO2 6 H2O becomes oxidized
H2O Light NADP Figure 10.6-1 ADP +P i LightReactions Chloroplast
H2O Light NADP Figure 10.6-2 ADP +P i LightReactions ATP NADPH Chloroplast O2
CO2 H2O Light NADP Figure 10.6-3 ADP +P i CalvinCycle LightReactions ATP NADPH Chloroplast O2
CO2 H2O Light NADP Figure 10.6-4 ADP +P i CalvinCycle LightReactions ATP NADPH Chloroplast [CH2O](sugar) O2
1 m 103 nm 1 nm 105 nm 103 nm 106 nm 103 m (109 nm) Radiowaves Micro-waves Gammarays UV X-rays Infrared Figure 10.7 Electromagnetic Spectrum Visible light 380 700 550 600 650 450 500 750 nm Longer wavelength Shorter wavelength Higher energy Lower energy
Chloroplasts absorb only certain colors Light Reflectedlight Chloroplast Figure 10.8 Absorbedlight Granum Transmittedlight
TECHNIQUE Chlorophyllsolution Photoelectrictube Refractingprism Whitelight Galvanometer Figure 10.9 High transmittance(low absorption):Chlorophyll absorbsvery little green light. Greenlight Slit moves topass lightof selectedwavelength. Low transmittance(high absorption):Chlorophyll absorbsmost blue light. Bluelight
Absorptionspectra (a) (c) Engelmann’sexperiment RESULTS Chloro-phyll a Chlorophyll b Absorption of light bychloroplast pigments Carotenoids 500 600 700 400 Figure 10.10 Wavelength of light (nm) Rate of photosynthesis (measured by O2 release) 400 500 600 700 (b) Action spectrum Aerobic bacteria Filamentof alga 400 500 600 700
Pigments in chloroplasts • Chlorophyll a: absorbs blue-violet and red • Chlorophyll b: absorbs blue and orange • Carotenoids: absorbs other wavelengths • Other pigments: found in various plants
CH3 in chlorophyll a CH3 CHO in chlorophyll b Porphyrin ring Figure 10.11 Chlorophyll Hydrocarbon tail(H atoms not shown)
“Excited” electrons • Ground state – where the electron is normally • Excited state – where the electron is when it becomes excited (usually an energy level farther from the nucleus) • More unstable • More potential energy
“Falling” electrons release energy Excitedstate e Figure 10.12 Heat Energy of electron Photon(fluorescence) Photon Groundstate Chlorophyllmolecule (a) Excitation of isolated chlorophyll molecule (b) Fluorescence
Photosystem STROMA Photon Light-harvestingcomplexes Reaction-centercomplex Primaryelectronacceptor Figure 10.13a e Thylakoid membrane Pigmentmolecules Special pair ofchlorophyll amolecules Transferof energy THYLAKOID SPACE(INTERIOR OF THYLAKOID) (a) How a photosystem harvests light
Photosystems • There are two photsystems in plants: • Photosystem II (P680): reaction center chlorophyll a absorbs light at 680 nm • Photosystem I (P700): reaction center chlorophyll a absorbs light at 700 nm
The Light Reactions • Sunlight used to make ATP and NADPH for the Calvin Cycle • Works by exciting electrons so that when they “fall”: • 1. The energy can be captured to make ATP • 2. The electrons can be placed on NADPH
2 1 Linear Electron Flow Primaryacceptor Figure 10.14-1 e P680 Light Pigmentmolecules Photosystem II(PS II)
2 3 1 Linear Electron Flow (cont.) Primaryacceptor Figure 10.14-2 e H2O 2 H + O2 1/2 e e P680 Light Pigmentmolecules Photosystem II(PS II)
2 3 1 5 4 Linear Electron Flow (cont.) Primaryacceptor Electron transport chain Pq Figure 10.14-3 e H2O Cytochromecomplex 2 H + O2 1/2 Pc e e P680 Light ATP Pigmentmolecules Photosystem II(PS II)
2 3 1 4 5 6 Linear Electron Flow (cont.) Primaryacceptor Primaryacceptor Electron transport chain e Pq Figure 10.14-4 e H2O Cytochromecomplex 2 H + O2 1/2 Pc e e P700 P680 Light Light ATP Pigmentmolecules Photosystem I(PS I) Photosystem II(PS II)
2 8 3 1 5 4 6 7 Linear Electron Flow (cont.) Electron transport chain Primaryacceptor Primaryacceptor Electron transport chain Fd e Pq Figure 10.14-5 e e e NADP H2O Cytochromecomplex 2 H + H NADPreductase + O2 NADPH 1/2 Pc e e P700 P680 Light Light ATP Pigmentmolecules Photosystem I(PS I) Photosystem II(PS II)
e e e MillmakesATP Figure 10.15 NADPH e e e Photon e ATP Photon Photosystem II Photosystem I
Cyclic Electron Flow Primaryacceptor Primaryacceptor Fd Fd Figure 10.16 NADP+ H Pq NADPreductase Cytochromecomplex NADPH Pc Photosystem I ATP Photosystem II
Chloroplast Mitochondrion Figure 10.17 CHLOROPLASTSTRUCTURE MITOCHONDRIONSTRUCTURE Diffusion H Thylakoidspace Intermembranespace Electrontransportchain Thylakoidmembrane Innermembrane ATPsynthase Matrix Stroma ADP Pi ATP Key Higher [H ] H Lower [H ]
2 1 3 Chemiosmosis (…again) STROMA(low H concentration) Cytochromecomplex NADPreductase Photosystem I Photosystem II Light 4 H+ Light NADP + H Fd Figure 10.18 Pq NADPH Pc H2O O2 1/2 THYLAKOID SPACE(high H concentration) 4 H+ +2 H+ ToCalvinCycle Thylakoidmembrane ATPsynthase ADP+P i ATP STROMA(low H concentration) H+
How are they different?: • Source of the electrons • Photo ________ • Oxi __________ • Source of the energy • Photo ________ • Oxi __________ • Fate of the electrons • Photo ________ • Oxi __________ Photophosphorylation vs. Oxidative Phosphorylation
CO2 ATP Input NADPH CALVIN CYCLE Output: G3P The Calvin Cycle
Input (Entering oneat a time) 3 CO2 Phase 1: Carbon fixation Rubisco 3 P P Short-livedintermediate Figure 10.19-1 6 P P 3 P Ribulose bisphosphate(RuBP) 3-Phosphoglycerate
Input (Entering oneat a time) 3 CO2 Phase 1: Carbon fixation Rubisco 3 P P Short-livedintermediate Figure 10.19-2 6 P P 3 P Ribulose bisphosphate(RuBP) 3-Phosphoglycerate 6 ATP 6 ADP CalvinCycle 6 P P 1,3-Bisphosphoglycerate 6 NADPH 6 NADP 6Pi 6 P Glyceraldehyde 3-phosphate(G3P) Phase 2: Reduction 1 P G3P(a sugar) Glucose andother organiccompounds Output
Input (Entering oneat a time) 3 CO2 Phase 1: Carbon fixation Rubisco 3 P P Short-livedintermediate Figure 10.19-3 6 P P 3 P Ribulose bisphosphate(RuBP) 3-Phosphoglycerate 6 ATP 6 ADP 3 ADP CalvinCycle 6 P P 3 ATP 1,3-Bisphosphoglycerate 6 NADPH Phase 3:Regeneration ofthe CO2 acceptor(RuBP) 6 NADP 6Pi P 5 G3P 6 P Glyceraldehyde 3-phosphate(G3P) Phase 2: Reduction 1 P G3P(a sugar) Glucose andother organiccompounds Output
H2O CO2 Light NADP+ ADP Fig. 10-21 P + i Light Reactions: Photosystem II Electron transport chain Photosystem I Electron transport chain RuBP 3-Phosphoglycerate Calvin Cycle ATP G3P Starch (storage) NADPH Chloroplast O2 Sucrose (export)
1 2 Figure 10.21 Sugarcane Pineapple Water Saving Adaptations C4 CAM CO2 CO2 CO2 incorporated(carbon fixation) Night Mesophyllcell Organic acid Organic acid CO2 CO2 Day Bundle-sheathcell CO2 releasedto the Calvincycle CalvinCycle CalvinCycle Sugar Sugar (a) Spatial separation of steps (b) Temporal separation of steps
Some heat energy escapes into space Sunlight Atmosphere Radiant heat trapped by CO2 and other gases Greenhouse Effect