Download
1 / 1
10 likes | 138 Views
Nelson-Denny Reading Comprehension Test ( NDRC ; Brown, Fishco, & Hanna, 1993) Nelson-Denny was administered in two forms; Consist of a reading/comprehension section; timed 20-minute, 38 questions. This test was used to measure long term changes. Mazes ( Timed Readings ; Spargo, 1975)

E N D
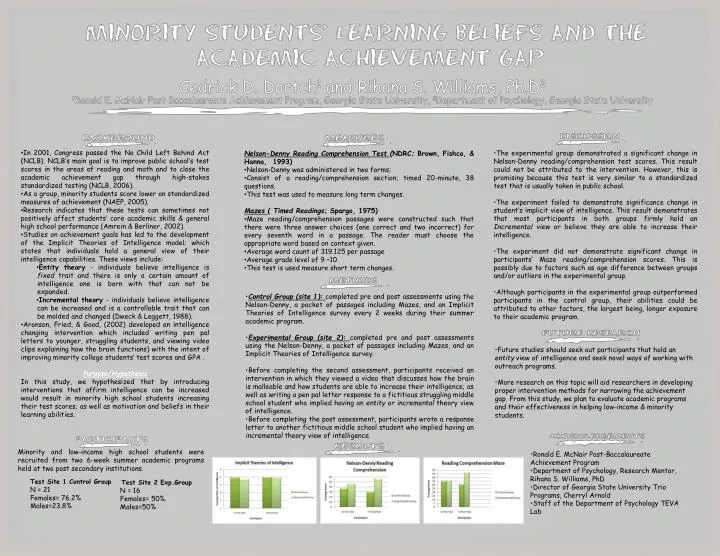
Nelson-Denny Reading Comprehension Test (NDRC; Brown, Fishco, & Hanna, 1993) • Nelson-Denny was administered in two forms; • Consist of a reading/comprehension section; timed 20-minute, 38 questions. • This test was used to measure long term changes. • Mazes ( Timed Readings; Spargo, 1975) • Maze reading/comprehension passages were constructed such that there were three answer choices (one correct and two incorrect) for every seventh word in a passage. The reader must choose the appropriate word based on context given. • Average word count of 319.125 per passage • Average grade level of 9 –10 • This test is used measure short term changes. • In 2001, Congress passed the No Child Left Behind Act (NCLB). NCLB’s main goal is to improve public school’s test scores in the areas of reading and math and to close the academic achievement gap through high-stakes standardized testing (NCLB, 2006). • As a group, minority students score lower on standardized measures of achievement (NAEP, 2005). • Research indicates that these tests can sometimes not positively affect students’ core academic skills & general high school performance (Amrein & Berliner, 2002). • Studies on achievement goals has led to the development of the Implicit Theories of Intelligence model; which states that individuals hold a general view of their intelligence capabilities. These views include: • Entity theory - individuals believe intelligence is fixed trait and there is only a certain amount of intelligence one is born with that can not be expanded. • Incremental theory - individuals believe intelligence can be increased and is a controllable trait that can be molded and changed (Dweck & Leggett, 1988). • Aronson, Fried, & Good, (2002) developed an intelligence changing intervention which included writing pen pal letters to younger, struggling students, and viewing video clips explaining how the brain functions) with the intent of improving minority college students’ test scores and GPA . • Purpose/Hypothesis • In this study, we hypothesized that by introducing interventions that affirm intelligence can be increased would result in minority high school students increasing their test scores; as well as motivation and beliefs in their learning abilities. • The experimental group demonstrated a significant change in Nelson-Denny reading/comprehension test scores. This result could not be attributed to the intervention. However, this is promising because this test is very similar to a standardized test that is usually taken in public school. • The experiment failed to demonstrate significance change in student’s implicit view of intelligence. This result demonstrates that most participants in both groups firmly hold an Incremental view or believe they are able to increase their intelligence. • The experiment did not demonstrate significant change in participants’ Maze reading/comprehension scores. This is possibly due to factors such as age difference between groups and/or outliers in the experimental group. • Although participants in the experimental group outperformed participants in the control group, their abilities could be attributed to other factors, the largest being, longer exposure to their academic program. • Control Group (site 1):completed pre and post assessments using the Nelson-Denny, a packet of passages including Mazes, and an Implicit Theories of Intelligence survey every 2 weeks during their summer academic program. • Experimental Group (site 2):completed pre and post assessments using the Nelson-Denny, a packet of passages including Mazes, and an Implicit Theories of Intelligence survey. • Before completing the second assessment, participants received an intervention in which they viewed a video that discusses how the brain is malleable and how students are able to increase their intelligence; as well as writing a pen pal letter response to a fictitious struggling middle school student who implied having an entity or incremental theory view of intelligence. • Before completing the post assessment, participants wrote a response letter to another fictitious middle school student who implied having an incremental theory view of intelligence. • Future studies should seek out participants that hold an entity view of intelligence and seek novel ways of working with outreach programs. • More research on this topic will aid researchers in developing proper intervention methods for narrowing the achievement gap. From this study, we plan to evaluate academic programs and their effectiveness in helping low-income & minority students. • Ronald E. McNair Post-Baccalaureate Achievement Program • Department of Psychology, Research Mentor, Rihana S. Williams, PhD • Director of Georgia State University Trio Programs, Cherryl Arnold • Staff of the Department of Psychology TEVA Lab Minority and low-income high school students were recruited from two 6-week summer academic programs held at two post secondary institutions. Test Site 1 Control Group N = 21 Females= 76.2% Males=23.8% Test Site 2 Exp.Group N = 16 Females= 50% Males=50%