Download
1 / 14
150 likes | 486 Views
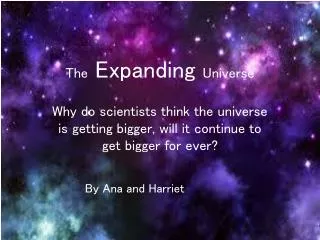
The Expanding Universe: Evidence for Acceleration. Review of Hubble’s Law Excel Activity: Hubble’s Law with recent data Modern interpretation of a Hubble diagram Brainstorm Activity: Hubble diagrams that account for a changing rate of expansion

E N D
The Expanding Universe:Evidence for Acceleration • Review of Hubble’s Law • Excel Activity: Hubble’s Law with recent data • Modern interpretation of a Hubble diagram • Brainstorm Activity: Hubble diagrams that account for a changing rate of expansion • Excel Activity: Hubble diagrams with very distant galaxies
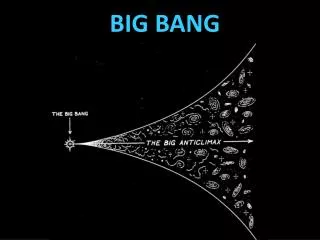
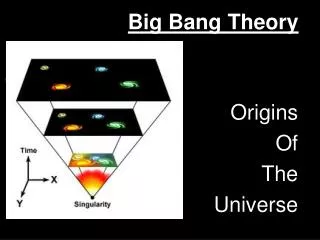
Part 1: What is Hubble’s Law? • In 1929 Edwin Hubble plotted the velocities of various galaxies vs. their distances • Interpretation: all galaxies are moving away from each other
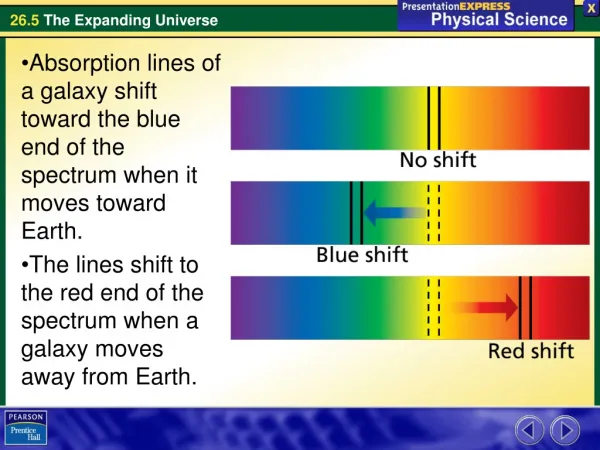
Measuring Velocity by Doppler Effect • Light waves and sound waves spread outward in circles. • If the source of waves is moving, then observer A will see these waves far apart (low frequency) while observer B sees them close together (high frequency). • For sound waves, different frequencies are heard as different pitches. For light waves, different frequencies are seen as different colors in the rainbow. • This change in frequency (Doppler Effect) can be used to measure the velocity of the source.
Redshift as a measure of velocity Definition of Redshift: z At low velocities
Measuring Distance:Brightness of a Standard Candle • Hubble used Cepheid variables and “typical” galaxies • Newest standard is Type Ia supernovae • As bright as an entire galaxy
Measuring brightnessand finding distance • Stellar brightness is quantified using “visual magnitude” scale • Hipparchus ranked stars from 1 to 6: 1 being the brightest in the sky, 6 the dimmest (with unaided eye) • Now we quantify magnitude: where m is apparent magnitude, d is distance, and M is the absolute magnitude--the brightness of the object from a distance of 10 parsecs (pc) • For Type Ia supernova,
Part II: Hubble’s Law with recent Data • Open “Expanding Universe Data” • Create a column of distances in megaparsecs. (Calculate these from visual magnitudes.) • Create a column of velocities in km/s (calculated from redshifts.) • Make a Hubble diagram. (Graph velocity vs. distance.)
Part 3: Interpretation of a Hubble Diagram • Slope of graph is called the Hubble constant; it represents the rate of expansion: from our graph • Work backwards and calculate the time since the Big Bang: if a galaxy were 1 Mpc away, how long would it take to reach Earth moving at a speed of 56 km/s? Hint:
Modern Interpretation of Hubble Diagram • Re-interpreting redshift: Wavelengths are stretched by expansion of space (not Doppler shifted by velocity). So the y-axis shows the percent by which the universe expanded during the time that light traveled a distance, d. • Example from our data: SN1990O z = 0.030; distance = 129 Mpc = 4.13 x 10⁸ ly So the universe expanded by 3.0% during the 413 million years that light traveled to us from this supernova.
So how do we interpret the graph? • Amount the universe has expanded as a function of time during which it has expanded. • Careful: Large values of time represent times long ago (from galaxies far, far away), not times in the future.
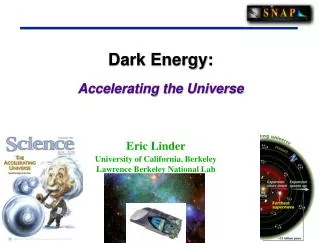
Part 4: Brainstorm Before 1998, most people assumed that gravity was causing the expansion of the universe to slow down. If this assumption were correct, and the universe used to be expanding at a faster rate, what would our graph look like when we include galaxies that are very far away? Would it be straight or curved? If it curves, would it curve up or down?
Part 5: Including Data for Distant Galaxies • Within the “Expanding Universe Data” there is a worksheet called “Distant Supernovae”. Copy this data and paste it immediately below the “Nearby” data. • “Fill Down” the formula for distance. • Make a graph of redshift vs. distance using both Nearby and Distant supernova data • Is the graph linear or does it curve? • How should we interpret this?
Measuring Velocity from Redshift • Doppler shift from receding source of light: • Redshift (z) is defined by: • Combining these:
Approximating… At low velocities