Download
1 / 1

E N D
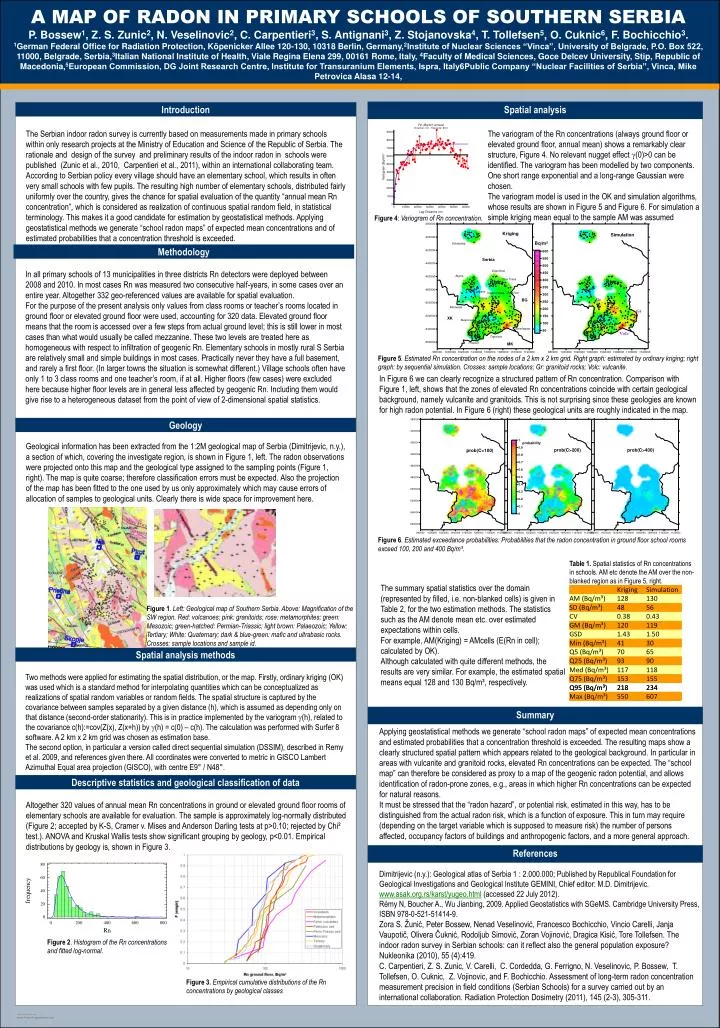
A MAP OF RADON IN PRIMARY SCHOOLS OF SOUTHERN SERBIA P. Bossew1, Z. S. Zunic2, N. Veselinovic2, C. Carpentieri3, S. Antignani3, Z. Stojanovska4, T. Tollefsen5, O. Cuknic6, F. Bochicchio3.1German Federal Office for Radiation Protection, Köpenicker Allee 120-130, 10318 Berlin, Germany,2Institute of Nuclear Sciences “Vinca”, University of Belgrade, P.O. Box 522, 11000, Belgrade, Serbia,3Italian National Institute of Health, Viale Regina Elena 299, 00161 Rome, Italy, 4Faculty of Medical Sciences, Goce Delcev University, Stip, Republic of Macedonia,5European Commission, DG Joint Research Centre, Institute for Transuranium Elements, Ispra, Italy6Public Company “Nuclear Facilities of Serbia”, Vinca, Mike Petrovica Alasa 12-14, Introduction Spatial analysis The Serbian indoor radon survey is currently based on measurements made in primary schools within only research projects at the Ministry of Education and Science of the Republic of Serbia. The rationale and design of the survey and preliminary results of the indoor radon in schools were published (Zunic et al., 2010, Carpentieri et al., 2011), within an international collaborating team. According to Serbian policy every village should have an elementary school, which results in often very small schools with few pupils. The resulting high number of elementary schools, distributed fairly uniformly over the country, gives the chance for spatial evaluation of the quantity “annual mean Rn concentration”, which is considered as realization of continuous spatial random field, in statistical terminology. This makes it a good candidate for estimation by geostatistical methods. Applying geostatistical methods we generate “school radon maps” of expected mean concentrations and of estimated probabilities that a concentration threshold is exceeded. The variogram of the Rn concentrations (always ground floor or elevated ground floor, annual mean) shows a remarkably clear structure, Figure 4. No relevant nugget effect (0)>0 can be identified. The variogram has been modelled by two components. One short range exponential and a long-range Gaussian were chosen. The variogram model is used in the OK and simulation algorithms, whose results are shown in Figure 5 and Figure 6. For simulation a simple kriging mean equal to the sample AM was assumed Figure 4: Variogram of Rn concentration. Methodology In all primary schools of 13 municipalities in three districts Rn detectors were deployed between 2008 and 2010. In most cases Rn was measured two consecutive half-years, in some cases over an entire year. Altogether 332 geo-referenced values are available for spatial evaluation. For the purpose of the present analysis only values from class rooms or teacher’s rooms located in ground floor or elevated ground floor were used, accounting for 320 data. Elevated ground floor means that the room is accessed over a few steps from actual ground level; this is still lower in most cases than what would usually be called mezzanine. These two levels are treated here as homogeneous with respect to infiltration of geogenic Rn. Elementary schools in mostly rural S Serbia are relatively small and simple buildings in most cases. Practically never they have a full basement, and rarely a first floor. (In larger towns the situation is somewhat different.) Village schools often have only 1 to 3 class rooms and one teacher’s room, if at all. Higher floors (few cases) were excluded here because higher floor levels are in general less affected by geogenic Rn. Including them would give rise to a heterogeneous dataset from the point of view of 2-dimensional spatial statistics. Figure 5. Estimated Rn concentration on the nodes of a 2 km x 2 km grid. Right graph: estimated by ordinary kriging; right graph: by sequential simulation. Crosses: sample locations; Gr: granitoid rocks; Volc: vulcanite. In Figure 6 we can clearly recognize a structured pattern of Rn concentration. Comparison with Figure 1, left, shows that the zones of elevated Rn concentrations coincide with certain geological background, namely vulcanite and granitoids. This is not surprising since these geologies are known for high radon potential. In Figure 6 (right) these geological units are roughly indicated in the map. Geology Geological information has been extracted from the 1:2M geological map of Serbia (Dimitrijevic, n.y.), a section of which, covering the investigate region, is shown in Figure 1, left. The radon observations were projected onto this map and the geological type assigned to the sampling points (Figure 1, right). The map is quite coarse; therefore classification errors must be expected. Also the projection of the map has been fitted to the one used by us only approximately which may cause errors of allocation of samples to geological units. Clearly there is wide space for improvement here. Figure 6. Estimated exceedance probabilities: Probabilities that the radon concentration in ground floor school rooms exceed 100, 200 and 400 Bq/m³. Table 1. Spatial statistics of Rn concentrations in schools. AM etc denote the AM over the non-blanked region as in Figure 5, right. The summary spatial statistics over the domain (represented by filled, i.e. non-blanked cells) is given in Table 2, for the two estimation methods. The statistics such as the AM denote mean etc. over estimated expectations within cells. For example, AM(Kriging) = AMcells (E(Rn in cell); calculated by OK). Although calculated with quite different methods, the results are very similar. For example, the estimated spatial means equal 128 and 130 Bq/m³, respectively. Figure 1. Left: Geological map of Southern Serbia. Above: Magnification of the SW region. Red: volcanoes; pink: granitoids; rose: metamorphites; green: Mesozoic; green-hatched: Permian-Triassic; light brown: Palaeozoic; Yellow: Tertiary; White: Quaternary; dark & blue-green: mafic and ultrabasic rocks. Crosses: sample locations and sample id. Spatial analysis methods Two methods were applied for estimating the spatial distribution, or the map. Firstly, ordinary kriging (OK) was used which is a standard method for interpolating quantities which can be conceptualized as realizations of spatial random variables or random fields. The spatial structure is captured by the covariance between samples separated by a given distance (h), which is assumed as depending only on that distance (second-order stationarity). This is in practice implemented by the variogram (h), related to the covariance c(h):=cov(Z(x), Z(x+h)) by (h) = c(0) – c(h). The calculation was performed with Surfer 8 software. A 2 km x 2 km grid was chosen as estimation base. The second option, in particular a version called direct sequential simulation (DSSIM), described in Remy et al. 2009, and references given there. All coordinates were converted to metric in GISCO Lambert Azimuthal Equal area projection (GISCO), with centre E9° / N48°. Summary Applying geostatistical methods we generate “school radon maps” of expected mean concentrations and estimated probabilities that a concentration threshold is exceeded. The resulting maps show a clearly structured spatial pattern which appears related to the geological background. In particular in areas with vulcanite and granitoid rocks, elevated Rn concentrations can be expected. The “school map” can therefore be considered as proxy to a map of the geogenic radon potential, and allows identification of radon-prone zones, e.g., areas in which higher Rn concentrations can be expected for natural reasons. It must be stressed that the “radon hazard”, or potential risk, estimated in this way, has to be distinguished from the actual radon risk, which is a function of exposure. This in turn may require (depending on the target variable which is supposed to measure risk) the number of persons affected, occupancy factors of buildings and anthropogenic factors, and a more general approach. Descriptive statistics and geological classification of data Altogether 320 values of annual mean Rn concentrations in ground or elevated ground floor rooms of elementary schools are available for evaluation. The sample is approximately log-normally distributed (Figure 2; accepted by K-S, Cramer v. Mises and Anderson Darling tests at p>0.10; rejected by Chi² test.). ANOVA and Kruskal Wallis tests show significant grouping by geology, p<0.01. Empirical distributions by geology is, shown in Figure 3. References Dimitrijevic (n.y.): Geological atlas of Serbia 1 : 2.000.000; Published by Republical Foundation for Geological Investigations and Geological Institute GEMINI, Chief editor: M.D. Dimitrijevic. www.asak.org.rs/karst/yugeo.html (accessed 22 July 2012). Rémy N, Boucher A., Wu Jianbing, 2009. Applied Geostatistics with SGeMS. Cambridge University Press, ISBN 978-0-521-51414-9. Zora S. Žunić, Peter Bossew, Nenad Veselinović, Francesco Bochicchio, Vincio Carelli, Janja Vaupotič, Olivera Čuknić, Rodoljub Simović, Zoran Vojinović, Dragica Kisić, Tore Tollefsen. The indoor radon survey in Serbian schools: can it reflect also the general population exposure? Nukleonika (2010), 55 (4):419. C. Carpentieri, Z. S. Zunic, V. Carelli, C. Cordedda, G. Ferrigno, N. Veselinovic, P. Bossew, T. Tollefsen, O. Cuknic, Z. Vojinovic, and F. Bochicchio. Assessment of long-term radon concentration measurement precision in field conditions (Serbian Schools) for a survey carried out by an international collaboration. Radiation Protection Dosimetry (2011), 145 (2-3), 305-311. Figure 2. Histogram of the Rn concentrations and fitted log-normal. Figure 3.Empirical cumulative distributions of the Rn concentrations by geological classes