Download
1 / 1
20 likes | 130 Views
AX877. KNP vs PGR. KNP vs EGR. CP. CP. Parameters of model. Parameters. of. model. 2. 2. PGR. r. , n. EGR. r. , n. a. b. a. b. CPT. CPT. -. 1. -. 1. -. 1. -. 1. -. 1. -. 1. -. 1. -. 1. -. 1. -. 1. -. 1. -. 1. (gr g. d. ). (gr g. d. ). (gr g. d.

E N D
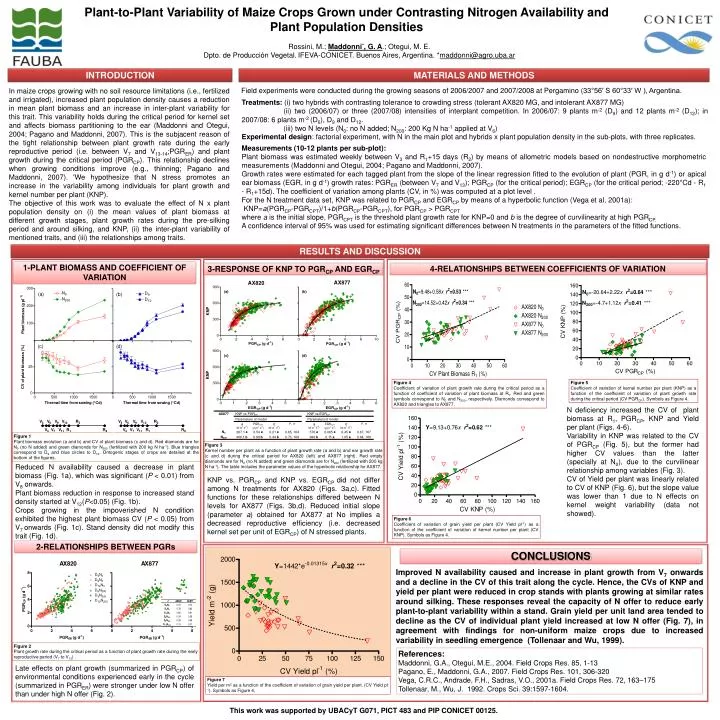
AX877 KNP vs PGR KNP vs EGR CP CP Parameters of model Parameters of model 2 2 PGR r , n EGR r , n a b a b CPT CPT - 1 - 1 - 1 - 1 - 1 - 1 - 1 - 1 - 1 - 1 - 1 - 1 (gr g d ) (gr g d ) (gr g d ) (gr g d ) (g pl d ) (g pl d ) N a a a a a a 267.1 0. 54 0. 21 570 0. 065 0. 45 0. 85 , 164 0. 67 , 167 0 N b b b b a a 406. 1 0. 88 0. 44 996 0.1 5 1.05 0.7 3 , 168 0. 6 4 , 168 200 Plant-to-Plant Variability of Maize Crops Grown under Contrasting Nitrogen Availability and Plant Population Densities Rossini, M.; Maddonni*, G. A.; Otegui, M. E. Dpto. de Producción Vegetal.IFEVA-CONICET. Buenos Aires, Argentina. *maddonni@agro.uba.ar INTRODUCTION MATERIALS AND METHODS Field experiments were conducted during the growing seasons of 2006/2007 and 2007/2008 at Pergamino (33°56′ S 60°33′ W ), Argentina. In maize crops growing with no soil resource limitations (i.e., fertilized and irrigated), increased plant population density causes a reduction in mean plant biomass and an increase in inter-plant variability for this trait. This variability holds during the critical period for kernel set and affects biomass partitioning to the ear (Maddonni and Otegui, 2004; Pagano and Maddonni, 2007). This is the subjacent reason of the tight relationship between plant growth rate during the early reproductive period (i.e. between V7 and V13-14;PGRER) and plant growth during the critical period (PGRCP). This relationship declines when growing conditions improve (e.g., thinning; Pagano and Maddonni, 2007). 'We hypothesize that N stress promotes an increase in the variability among individuals for plant growth and kernel number per plant (KNP). The objective of this work was to evaluate the effect of N x plant population density on (i) the mean values of plant biomass at different growth stages, plant growth rates during the pre-silking period and around silking, and KNP, (ii) the inter-plant variability of mentioned traits, and (iii) the relationships among traits. Treatments: (i)two hybrids with contrasting tolerance to crowding stress (tolerant AX820 MG, and intolerant AX877 MG) (ii) two (2006/07) or three (2007/08) intensities of interplant competition. In 2006/07: 9 plants m-2 (D9) and 12 plants m-2 (D12); in 2007/08: 6 plants m-2 (D6), D9 and D12. (iii) two N levels (N0: no N added; N200: 200 Kg N ha-1 applied at V6) Experimental design: factorial experiment, with N in the main plot and hybrids x plant population density in the sub-plots, with three replicates. Measurements (10-12 plants per sub-plot): Plant biomass was estimated weekly between V3 and R1+15 days (R2) by means of allometric models based on nondestructive morphometric measurements (Maddonni and Otegui, 2004; Pagano and Maddonni, 2007). Growth rates were estimated for each tagged plant from the slope of the linear regression fitted to the evolution of plant (PGR, in g d-1) or apical ear biomass (EGR, in g d-1) growth rates: PGRER (between V7 and V13); PGRCP (for the critical period); EGRCP (for the critical period; -220°Cd - R1 - R1+15d). The coefficient of variation among plants (CV, in %) was computed at a plot level . For the N treatment data set, KNP was related to PGRCP and EGRCP by means of a hyperbolic function (Vega et al, 2001a): KNP=a(PGRCP-PGRCPT)/1+b(PGRCP-PGRCPT), for PGRCP > PGRCPT where a is the initial slope, PGRCPT is the threshold plant growth rate for KNP=0 and b is the degree of curvilinearity at high PGRCP. A confidence interval of 95% was used for estimating significant differences between N treatments in the parameters of the fitted functions. RESULTS AND DISCUSSION 1-PLANT BIOMASS AND COEFFICIENT OF VARIATION 4-RELATIONSHIPS BETWEEN COEFFICIENTS OF VARIATION 3-RESPONSE OF KNP TO PGRCP AND EGRCP AX877 AX820 Figure 4 Coefficient of variation of plant growth rate during the critical period as a function of coefficient of variation of plant biomass at R1. Red and green symbols correspond to N0 and N200, respectively. Diamonds correspond to AX820 and triangles to AX877. Figure 5 Coefficient of variation of kernel number per plant (KNP) as a function of the coefficient of variation of plant growth rate during the critical period (CV PGRCP). Symbols as Figure 4. N deficiency increased the CV of plant biomass at R1, PGRCP, KNP and Yield per plant (Figs. 4-6). Variability in KNP was related to the CV of PGRCP (Fig. 5), but the former had higher CV values than the latter (specially at N0), due to the curvilinear relationship among variables (Fig. 3). CV of Yield per plant was linearly related to CV of KNP (Fig. 6), but the slope value was lower than 1 due to N effects on kernel weight variability (data not showed). Figure 1 Plant biomass evolution (a and b) and CV of plant biomass (c and d). Red diamonds are for N0 (no N added) and green diamonds for N200 (fertilized with 200 kg N ha-1). Blue triangles correspond to D9 and blue circles to D12. Ontogenic stages of crops are detailed at the bottom of the figures. Figure 3 Kernel number per plant as a function of plant growth rate (a and b) and ear growth rate (c and d) during the critical period for AX820 (left) and AX877 (right). Red empty diamonds are for N0 (no N added) and green diamonds are for N200 (fertilized with 200 kg N ha-1). The table includes the parameter values of the hyperbolic relationship for AX877. Reduced N availability caused a decrease in plant biomass (Fig. 1a), which was significant (P < 0.01) from V8 onwards. Plant biomass reduction in response to increased stand density started at V12(P<0.05) (Fig. 1b). Crops growing in the impoverished N condition exhibited the highest plant biomass CV (P < 0.05) from V7 onwards (Fig. 1c). Stand density did not modify this trait (Fig. 1d). KNP vs. PGRCP and KNP vs. EGRCP did not differ among N treatments for AX820 (Figs. 3a,c).Fitted functions for these relationships differed between N levels for AX877 (Figs. 3b,d). Reduced initial slope (parameter a) obtained for AX877 at No implies a decreased reproductive efficiency (i.e. decreased kernel set per unit of EGRCP) of N stressed plants. Figure 6 Coefficient of variation of grain yield per plant (CV Yield pl-1) as a function of the coefficient of variation of kernel number per plant (CV KNP). Symbols as Figure 4. 2-RELATIONSHIPS BETWEEN PGRs CONCLUSIONS Improved N availability caused and increase in plant growth from V7 onwards and a decline in the CV of this trait along the cycle. Hence, the CVs of KNP and yield per plant were reduced in crop stands with plants growing at similar rates around silking. These responses reveal the capacity of N offer to reduce early plant-to-plant variability within a stand. Grain yield per unit land area tended to decline as the CV of individual plant yield increased at low N offer (Fig. 7), in agreement with findings for non-uniform maize crops due to increased variability in seedling emergence (Tollenaar and Wu, 1999). Figure 2 Plant growth rate during the critical period as a function of plant growth rate during the early reproductive period (V7 to V13) . References: Maddonni, G.A., Otegui, M.E., 2004. Field Crops Res. 85, 1-13 Pagano, E., Maddonni, G.A., 2007. Field Crops Res. 101, 306-320 Vega, C.R.C., Andrade, F.H., Sadras, V.O., 2001a. Field Crops Res. 72, 163–175 Tollenaar, M., Wu, J. 1992. Crops Sci. 39:1597-1604. Late effects on plant growth (summarized in PGRCP) of environmental conditions experienced early in the cycle (summarized in PGRER) were stronger under low N offer than under high N offer (Fig. 2). Figure 7 Yield per m2 as a function of the coefficient of variation of grain yield per plant. (CV Yield pl-1). Symbols as Figure 4. This work was supported by UBACyT G071, PICT 483 and PIP CONICET 00125.