Download
1 / 18
180 likes | 286 Views
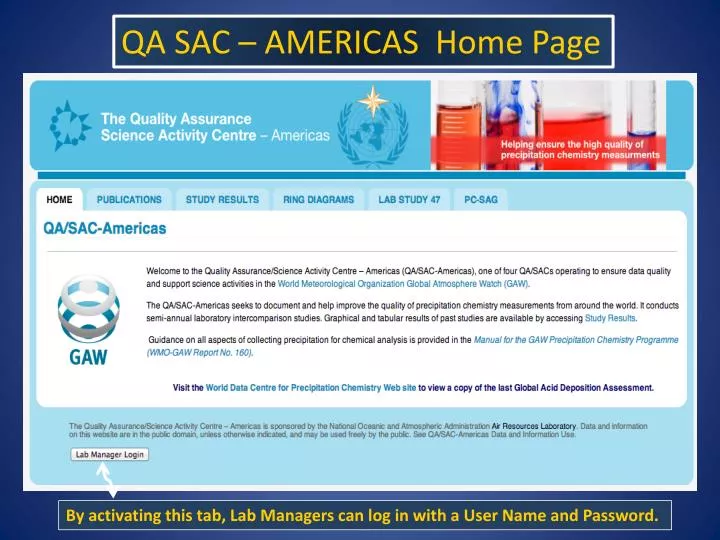
QA SAC – AMERICAS Home Page. By activating this tab, Lab Managers can log in with a User Name and Password. When Lab Managers log into the QA/SAC system, they can: Update contact information Edit shipping address, latitude/longitude, etc.

E N D
QA SAC – AMERICAS Home Page By activating this tab, Lab Managers can log in with a User Name and Password.
When Lab Managers log into the QA/SAC system, they can: • Update contact information • Edit shipping address, latitude/longitude, etc. • Enter biannual Lab Intercomparison Study reports. (Half of lab managers now enter reports directly on-line.)
An example of two U.S. labs, one that performs well and one with some analytical problems.
Total acidity is optional and was not measured. Fluoride is optional and was not measured.
QA-SAC Goals/Considerations • Change ring diagrams to include category for biased measurements (+ 10%) • Red arrow for “biased” measurements that have (Z < -1.645 or Z > 1.645) • Red trapezoid for “???” measurements outside IQ range but (Z > -1.645 or Z < 1.645)
In selecting a lab, the location is highlighted on the map. The address, Website, and ‘Stations Served’ appear. For the CAPMoN lab, the CAPMoN Station Map and CAPMoN Data are links to Websites where CAPMoN data can be accessed and retrieved. In addition, there is a link to laboratory performance/quality assurance data .
-> Active Station -> Laboratory -> Inactive Station
Laboratory Information • Lab Website link • List of stations served by the lab • Link to Ring Diagrams for lab
Increase or Decrease Scale • Station Information • Lab ID links to Lab Information • Station Data links to EMEP Website
WDCPC Goals/Considerations • Complete addition of European stations • Develop database for assessment data set • Selective data retrievals: date range, station, geographic area • Station map