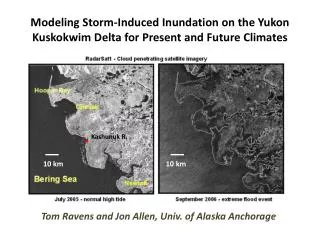
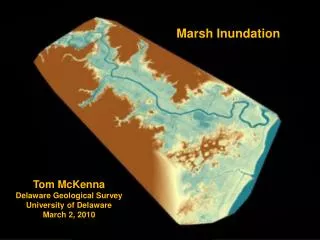
Download
1 / 45
450 likes | 579 Views
Extratropical Storm-Induced Coastal Inundation: Scituate, MA . Robert C. Beardsley 1 , Changsheng Chen 2 , Qichun Xu 2 , Jianhua Qi 2 , Huichan Lin 2. 1 Department of Physical Oceanography Woods Hole Oceanographic Institution Woods Hole, MA 02543. 2 School for Marine Science and Technology

E N D
Extratropical Storm-Induced Coastal Inundation: Scituate, MA Robert C. Beardsley1, Changsheng Chen2, Qichun Xu2, Jianhua Qi2, Huichan Lin2 1Department of Physical Oceanography Woods Hole Oceanographic Institution Woods Hole, MA 02543 2School for Marine Science and Technology University of Massachusetts-Dartmouth New Bedford, MA 02744 E-mail: rbeardsley@whoi.edu; c1chen@umassd.edu; qxu@umassd.edu; jqi@umassd.edu; hlin@umassd.edu
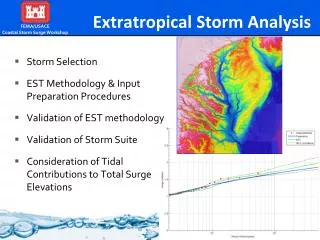
Overall Goal Investigate roles of model structure and physics, waves, wave-surge interaction, grid resolution, computational effort on hindcasting inundation on a local scale driven by an extratropical storm in the Gulf of Maine. Objectives • Hindcast inundation at Scituate (MA) during two recent (2005 and 2007) Nor’easters using suite of models with the same grid and forcing; • Compare model output with available field data; • Inter-compare model output; • Formulate initial comparison results and plans for additional model tests.
The Test Site: Scituate, MA 44013
Initial Test Storm Cases May 24 2005 storm; April 17, 2007 (“Patriot’s Day”) storm; Model validation for tides: May 1-June 1, 2010 Boston tide gauge and NOAA 440013 Nor’easter
The Northeast Coastal Ocean Forecast System (NECOFS) grid The Scituate Grid Nested Horizontal Resolution: 10 m to 1 km Cell number: 11153 Node number: 5620
Buoys with wave measurements Total 20 stations Station No. Longitude(W) Latitude (N) 44004 70.433 38.484 44005 69.140 43.189 44007 70.144 43.531 44008 69.431 40.500 44009 74.702 38.464 44013 70.691 42.354 44017 72.046 40.691 44018 69.294 41.259 44024 65.927 42.312 44025 73.166 40.250 44027 67.314 44.273 44029 70.570 42.520 44030 70.418 43.183 44031 70.060 43.570 44032 69.358 43.715 44033 69.000 44.060 44034 68.110 44.110 44035 67.020 44.890 44037 67.883 43.484 44038 66.550 43.633
Model-Model Comparisons • Transects • Elevation • Mass Flux • Wave Energy Flux (?) • Points • Tide gauge • E. Foster Bridge • Harbor Master/Town Pier • Cedar Point depression • Jericho Road • Center of harbor mouth transect Model-Data Comparison 44 Rebecca Road
Points and sections in the grid Sites and sections in the model grid STATIONS NODE NUMBER LONGITUDE LATITUDE A 3078 -70.7233658 42.2058182 B 5301 -70.7239990 42.2021598 C 5446 -70.7248611 42.1981239 D 4216 -70.7214050 42.1923218 E 2543 -70.7172089 42.1955299 F 5140 -70.7198868 42.1993752 G 3484 -70.7163010 42.2028236 H 2792 -70.7182312 42.2070961 I 1898 -70.7178879 42.2078705 A1 I H A A2 B2 B G SECTIONS FROM NODE NUMBER LONGITUDE LATITUDE TO NODE NUMBER LONGITUDE LATITUDE Section A -70.7221832 42.2072754 4133 -70.7191620 42.2062111 Section B -70.7163162 42.2017404 -70.7152786 42.2042465 Section C 3401 -70.7259140 42.1923523 3576 -70.7204742 42.1923676 B1 F C E C1 D C2
The Model Forcing and Boundaries for 2005 and 2007 The grid, forcing, boundary conditions, and initial conditions are uploaded at 2005 storm: /data/ftp/upload/Inundation/umass/fvcom_extratropical/2005_fine_grid1/wave_current/input/ 2007 storm: /data/ftp/upload/Inundation/umass/fvcom_extratropical/2007_fine_grid1/wave_current/input/ Grid: sci_cor.dat --------The latitude at each node: used for Coriolis term sci_dep.dat ------- The water depth at each node sci_grd.dat --------The model mesh sci_obc.dat -------- Node numbers and types at the nesting boundary sci_sigma11.dat --------Vertical coordinate levels and type sci_spg.dat --------Sponge layer setup at the boundary (not need here) sci_restart_wd.dat --------Restart file with types of nodes and cells for the wet and dry
Input files for 2005 and 2007 Forcings: Wind forcing (9×9 km WRF hindcast field-the wind velocity at the 10-m height ) Heat flux and precipitation via evaporation (9×9 km WRF hindcast field) The sea level at the nodes of the nesting boundary (5 tidal constituents: M2, N2, S2, K1 and O1 and subtidal sea level) Velocity at the centers of cells 2005 node_nest.nc ---------------------------------------Open boundary nesting file restart20050501.nc ------------------------------- Restart file for May 01 2005 model run wrf_for.nc or gom_mm5_forcing_20050501-20050601.nc --- Winds, heat flux and P-E 2007 node_nest.nc ------------------------------------ Open boundary nesting file restart20070401.nc ---------------------------- Restart file for April 01 2007 model run wrf_for.nc ----------------------------------------- Winds, Heat Flux and P-E
The FVCOM Validation for Tidal Simulation Tide Freq Amp (m) Amp error (m) Phase (oG) Phase error (oG) M2 0.0805114 1.2729 0.021 339.21 0.97 N2 0.0789992 0.2858 0.022 43.60 4.79 S2 0.0833333 0.1669 0.018 154.03 8.13 K1 0.0417807 0.1254 0.004 183.54 2.02 O1 0.0387307 0.0988 0.004 76.93 2.46
The 2005 Nor’easter Storm May 25, 05 AM (GMT) Currents-Waves Currents
Site H Winds Sea Level Vertically averaged velocity
Site A (western coast) Winds Sea Level Vertically averaged velocity
Site B (western coast) Winds Sea Level Vertically averaged velocity
Site C (southwestern coast) Winds Sea Level Vertically averaged velocity
Site D (southern are near the bridge) Winds Sea Level Vertically averaged velocity
Site F (eastern coast) Winds Sea Level Vertically averaged velocity
Site G (entrance) Winds Sea Level Vertically averaged velocity
2007 Nor’easter Storm Currents April 18 , 04 AM (GMT) Currents-Waves
Site H (flooded area) Winds Sea Level Vertically averaged velocity
Site A (eastern coast) Winds Sea Level Vertically averaged velocity
Site B (eastern coast) Winds Sea Level Vertically averaged velocity
Site C (southeastern coast) Winds Sea Level Vertically averaged velocity
Site D (southern area closed to bridge) Winds Sea Level Vertically averaged velocity
Site F (eastern coast) Winds Sea Level Vertically averaged velocity
Site G (entrance) Winds Sea Level Vertically averaged velocity
Preliminary Results for the December 27 2010 Storm 7 EST Dec. 26 7 EST Dec. 27 7 EST Dec. 28
9 Tidal Constituents (two year records) Tide Freq Amp (m) Amp error (m) Phase (oG) Phase error (oG) M2 0.0805114 1.2702 0.021 340.03 0.90 N2 0.0789992 0.3009 0.021 308.67 4.28 S2 0.0833333 0.1982 0.022 12.31 5.54 H1 0.0803973 0.1840 0.020 56.99 6.70 H2 0.0806255 0.1780 0.021 248.07 6.78 K1 0.0417807 0.1389 0.004 137.64 1.59 O1 0.0387307 0.1129 0.004 124.89 2.21 P1 0.0415526 0.0424 0.005 132.99 5.83 M4 0.1610228 0.0160 0.002 108.91 5.74
Questions raised from the 2010 Nor’easter storm simulation : How could we improve the tidal simulation for the long-term variation of the sea level? How could we count the effects of the snow? Should we increase the time interval of the wind forcing from one hour to a shorter period?
Buoy 44013 2005 2007
Buoy 44029 2005 2007
2010 December Wave Forecast Buoy 44005 Buoy 44018