Download

1 / 28
430 likes | 703 Views
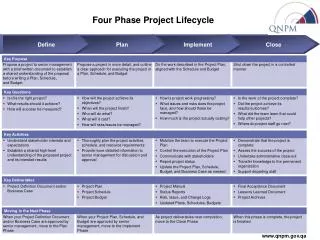
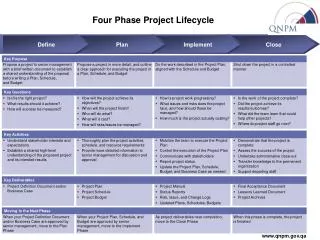
Technical BI Project Lifecycle. Business Intelligence. BI Project Lifecycle. BI Project Technical Lifecycle. Discuss the Technical Pieces of the BI Project Lifecycle Dimensional Modeling Physical Design ETL Design and Development BI Application Framework Dimensional Model

E N D
Technical BI Project Lifecycle Business Intelligence
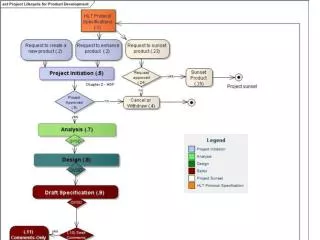
BI Project Technical Lifecycle • Discuss the Technical Pieces of the BI Project Lifecycle • Dimensional Modeling • Physical Design • ETL Design and Development • BI Application • Framework Dimensional Model • Framework Relation Model • Transformer OLAP Powercube • Report Studio • Query Studio • Analysis Studio • Cognos Connection
Dimensional Modeling • Using Kimball Methodology to design the data into a star schema dimensional model. • Dimensions answer the who, what, when, and where. • Facts give the measure values, the numerical numbers for the data, how much, how often, how many. • The dimensional model is denormalized to allow for ease of reporting.
ETL Design • ETL stands for Extraction, Transformation, and Load • Extraction: Gathering the required data from source systems • Transformation: Convert the data into the required form for the data mart • Load: Populate the data mart with the data
ETL Dimensional Load Dim_Staff Dimensional Load Load into this Connection Build Properties Data Source and SQL to extract Dimensional Hierarchy Defines the behavior of the columns, business and surrogate keys, effective dates, etc. Assigns Slowly Changing Dimensions and Indexes to columns loaded to data mart
ETL Fact Load The ETL Fact Load loads the fact table with its measures and dimensional references into the data mart. Reference Dimensional Lookups Source Database Connection The fact load, includes the columns to index, and how to update the data. The update types can be a full truncate/refresh, or an incremental update model depending on the data needs. Defines how to identify update rows for optimal performance. SQL statement to extract the data from source, usually also contains some transformation in the SQL. Model to transform the data elements into the required elements in the data mart. This would include any calculations or advanced functions based on inputs. In this case, most of the transformation was done in SQL and the mapping is just a straight pass through of the data. Also does the reference lookup to find the surrogate key of the dimension referenced and passed the surrogate key, not the business key to the fact table.
ETL Jobstream The jobstream manages running all the builds along with any other steps needed to build the data mart. Other Jobstreams Dimension Builds Fact Builds
Data Mart • After all the data modeling and ETL work has been accomplished, there is now a data mart available to be used for reporting and analysis. • This part of the technical process can often represent 70-80% of the technical development effort. • Once there is a good data mart with a strong dimensional model, the reporting and analysis should be easier to develop and more responsive.
BI Application Development • Cognos Framework Development to develop the packages used by report developers, query studio users and analysis studio users. • Cognos Transformer Development to develop the OLAP powercubes used for analysis and dimensional reports. • Cognos Report Studio Development to create complex reports with guided prompting, drill-throughs, and visualized information to allow the user to understand their data.
Framework Model A framework model defines the metadata relationships in the data mart and develops the packages that are published to the user community. These predefined relationships and query subjects allows for users to develop reports and adhoc queries without having to know SQL, what a join is, or even what the data model looks like. This example shows the basic diagram of relationships for the relational model and dimensional model that was developed for the Granite data mart.
Framework Relational Models Full Relational Model for Report developers. This model contains all the data items from the data mart giving the most power to the advanced users who have access to report studio. Query Tables Query Attribute Query Identifier Query Facts Query Folders – These contain multiple query tables. Query Filters – Predefined filters that report developers can use. Simplified Relational Model for Query Studio users. Gives users the required dimensions and measures with predefined filters, but minimizes the number of attributes, and uses only a single query table. This is for Ad-hoc users to quickly look up data. Query Calculation
Framework Dimensional Model Dimensional Model is used in Report Studio and Analysis Studio to generate dimensional style reports like crosstabs and charts. It uses sets and slices to display the data instead of grouping and filters. Dimension Measure Dimensions Alternate Drill Downs Measures Attributes of member Folders containing multiple dimensions Hierarchy Predefined Filters Levels
Transformer Model The transformer model is used to design the OLAP (OnLine Analytical Processing) Powercube. A powercube allows for the data to be analyzed quickly and easily. It is a pre-summarized dimensional data structure that can be used in Analysis Studio for online analysis, or in Report Studio as a dimensional data source. Since the cube is a separate data structure, it can return results quickly, and can be transported separate from the database. A powercube is used for summary analysis, while the detail data is still left in the data mart for drill-through reporting. Dimensional structure of the cube showing hierarchy and alternate drill down paths. List of measures used in the powercube. List of powercubes created. Can have multiple cubes based on a dimensional structure. Properties for a measure, here showing the types of rollup to apply to that measure. Data sources using SQL coded IQD files with the columns. Structure data (dimensions) before measure data.
Cognos 8 Web Based Tools • Everything shown so far is the back end work that needs to be accomplished to present the data to the user, whether the user is a report developer, business analyst, or consumer, they will then use one of the following tools to access this data. • Report Studio – Advanced development platform for writing complex reports. • Query Studio – Simplified Online Ad-hoc environment for business analysts. • Analysis Studio – Online analysis tool to access dimensional data with slice/dice, drill-up/drill-down and crosstab. • Cognos Connection – Web portal to access the studios and reports for all users.
Report Studio The Report Studio is an advanced IDE platform for report design. It allows for complex multipage reports with prompts, drill-throughs, java script, multiple queries and other advanced functionality. Report Studio is intended for the advanced developer to create reports to be consumed. Even though these are created reports, they can be dynamic with complex prompts that execute at run-time. InsertableObjects for the report Page Layout for the report, with Title, Headers, Grouping, List Frame, data objects, and footer. One of the data objects is blue to indicate that there is a drill-through allowed on that data object. Properties pane for the select object.
Query Studio Query Studio utilizes a simplified data package and allows for business analysts and other advanced users to write ad-hoc queries against the data without having to request a full report be developed. This allows the users to get access to their required data without needing to know how to use the advanced tools in Report Studio or utilize a report studio developer. Report Layout page with drag and drop addition of query items. This design is online, meaning data items will show up from the database when added to the report. Query Item List Filter design to add a filter to the query using a simple GUI interface. Any ad-hoc query developed in query studio can be moved into Report Studio and expanded upon if the report needs to be further developed or formatted for larger community usage.
Analysis Studio Analysis Studio is for business analysts to quickly work with their dimensional data. Analsysis Studio can be used against any dimensional data source, a dimensional package from framework, a powercube, or another OLAP system. Data Element and Context Pane Chart Object Analysis Studio is online and all work with the data is interactive. A user can click on dimensional elements in the crosstab or charts to drill-up or drill-down the hierarchy of that dimension. The user can easily add or remove rows and columns. Also, a user can slice the data by adding dimensional members to the Context pane. Insertable Objects Crosstab Object
Cognos Connection Cognos Connection is the portal page that users can use to access reports, archives, and studios. Any user who has access to Cognos utilizes the Cognos Connection to get to their objects. The consumer level user who can only access reports would utilize this page to find the report and click on the run or view archive to either dynamically generate the report or access a previously run version. Studios available to the user Last modification date of the object, when the report spec was updated or the report archive was updated. List of objects (reports, queries, report views, packages) that the user has access to. List of actions the user can do with the object. See properties, run report, open the report studio, create a report view, schedule the report…