Download
1 / 6
70 likes | 180 Views
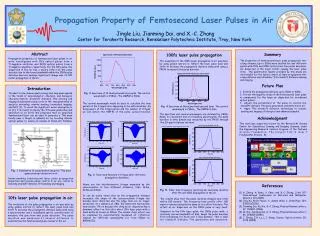
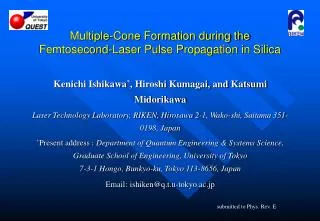
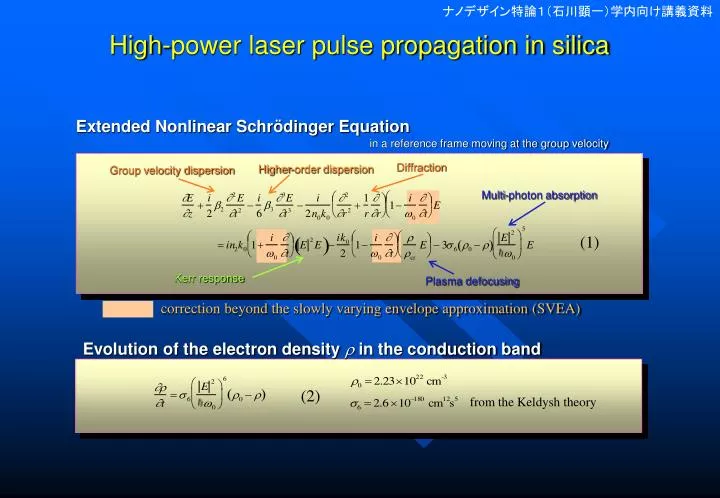
Diffraction. Higher-order dispersion. Group velocity dispersion. Multi-photon absorption. Kerr response. Plasma defocusing. correction beyond the slowly varying envelope approximation (SVEA). Evolution of the electron density r in the conduction band. from the Keldysh theory.

E N D
Diffraction Higher-order dispersion Group velocity dispersion Multi-photon absorption Kerr response Plasma defocusing correction beyond the slowly varying envelope approximation (SVEA) Evolution of the electron density r in the conduction band from the Keldysh theory High-power laser pulse propagation in silica Extended Nonlinear Schrödinger Equation in a reference frame moving at the group velocity (1) (2)
Radius r (mm) 3rd cone Self-focusing Self-steepening Plasma defocusing 5 0 10 6 0 3 9 10 0 5 15 Change of the spatio-temporal intensity profile with propagation input energy = 135mJ propagation distance z = 3200 mm 3300 mm 3400 mm 3500 mm 3600 mm (d) (e) (a) (c) (b) 1st cone 2nd cone 5000 mm 3700 mm 3800 mm 4000 mm 4500 mm (g) (f) (j) (i) (h) More than 10 cones Intensity (1012 W/cm2)
3300 mm 3400 mm 1st cone 2nd cone Mechanism of the multiple-cone formation • At z = 3340 mm, the intensity decreases with increasing r in the range r = 9 - 12 mm, while Dn is nearly flat there. • Due to self-focusing, the first peak takes up much energy from its vicinity. • At z = 3360 mm, the second local maximum in Dn is formed around r = 11.3 mm. → The local self-focusing leads to the grow-up or the second cone. Fig. Radial distribution of intensity and refractive index change Dn at t = 44 fs.
Fluence vs. Propagation distance Self-focusing Propagation Propagation distance (micron) Propagation distance (mm) Radius (mm) Plasma defocusing Fluence (10-15 J/cm2) Fluence (10-15 J/cm2)
10 0 5 15 Dependence on the input energy Input energy With decreasing input pulse energy, • the number of cones decreases. • the cones are more parallel to the beam axis. The multiple-cone formation ceases when we further decrease the input energy. 135 mJ, z = 4500 mm 45 mJ, z = 5500 mm 15 mJ, z = 7000 mm Radius r (mm) Radius r (mm) Radius r (mm) Intensity (1012 W/cm2)
Conclusion • When the input power is several hundred times higher than Pcr, the pulse is split many times both temporally and spatially. • As a result, the intensity distribution contains multiple cones. This is a new feature that emerges only in thehigh-power regime • This structure is formed by the interplay of Kerr self-focusing and plasma defocusing.