Download
1 / 19
190 likes | 318 Views
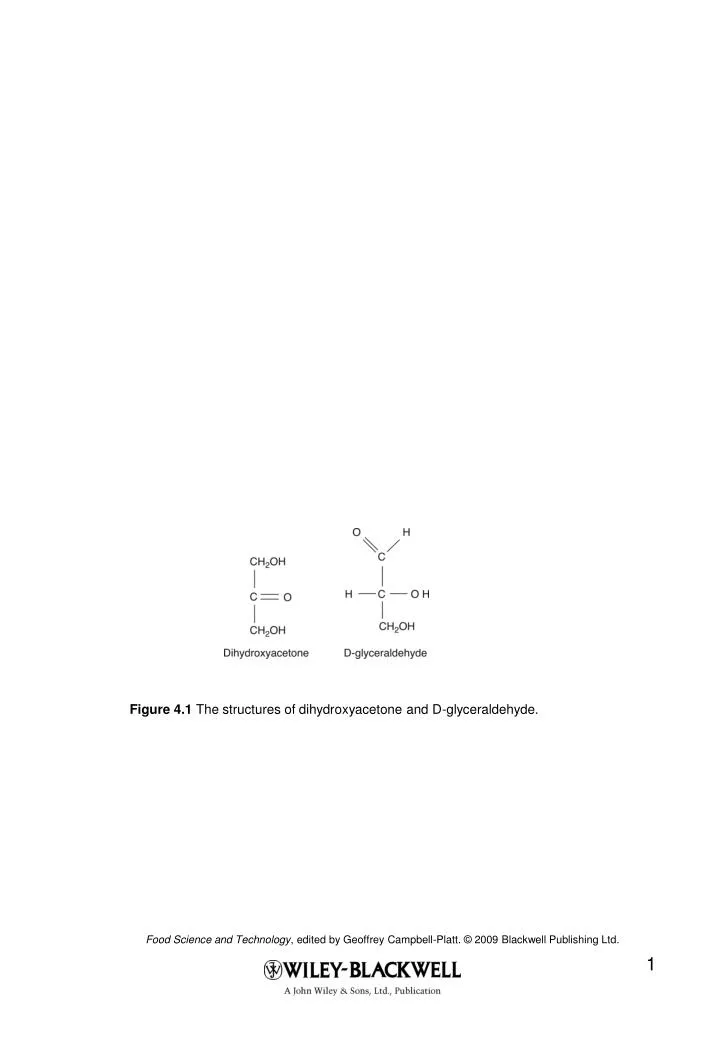
Figure 4.1 The structures of dihydroxyacetone and D-glyceraldehyde.

E N D
Figure 4.1 The structures of dihydroxyacetone and D-glyceraldehyde.
Figure 4.2 The structures of D-glucose and D-mannose, epimers of each other. The linear sugar structures (top) are shown in a manner which highlights that glucose and mannose are near-mirror images; however, note that the two sugars have opposite configurations at asymmetric centre C2.
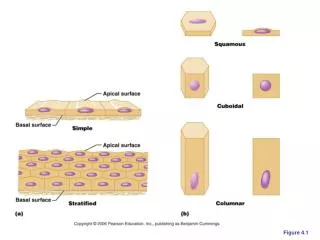
Figure 4.3 The five- and six-member ring structures of furanoses and pyranoses, respectively, represented here by fructose and glucose.
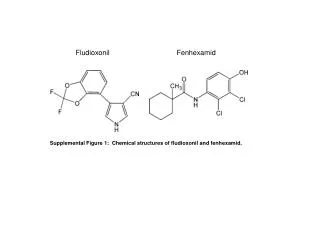
Figure 4.4 Left shows the structure of maltose, two glucose units joined by an α-1,4-glycosidic linkage, a type of O-glycosidic linkage. Middle is another example of an O-glycosidic linkage, that between C6 of glucose and inorganic phosphate in glucose 6-phosphate. Right is deoxyadenosine, a component of DNA which contains an N-glycosidic linkage between deoxyribofuranose and the base adenine.
Figure 4.5 The structures of maltol (left) and furaneol (right).
Figure 4.6 The product of the Amadori reaction, 1-amino-1-deoxyketose, which can further rearrange, dehydrate, and deaminate resulting in various possible aldehyde compounds.
Figure 4.7 Cellulose is bound by beta-1,4 linkages with every other glucose residue flipped 180 degrees. Structural rigidity is provided by hydrogen bonding between the ring O and C3 OH.
Figure 4.8 Carrageenans have alternating β- and α-galactose residues joined by alternating α-1,3 and β-1,4 glycosidic links. Lambda carrageenan is shown above where R is either H or SO3−.
Figure 4.9 The four carbon intermediates of glycolysis are derivatives of four 3-C molecules: dihydroxyacetone, glyceraldehyde, glycerate, and pyruvate. Glucose and fructose are the base molecules for 6-C intemediates.
Figure 4.10 The intermediates of glycolysis. All glycolytic intermediates are phosphorylated. The 3-C reactions beginning with glyceraldehyde 3-P occur twice per glucose entering glycolysis.
Table 4.1 Categorizing the 20 amino acids and their side chain pK values.
Figure 4.12 Cross section of a fat globule in an emulsion, visualized by transmission electron microscopy, showing the darkly stained proteinaceous membrane that forms around the periphery as the hydrophobic portions of proteins adsorb to fat interfaces during emulsification. Fat globules are approximately 1 μm in diameter, membrane thickness is approximately 101 nm. (Image courtesy of Prof. H. D. Goff, University of Guelph.)
Figure 4.13 12% acrylamide SDS-PAGE stained with Coomassie brilliant blue R-250, a protein-binding dye. Lanes 3 and 9 contain molecular weight standards for the determination of unknown sample bands’ masses.
Table 4.2 Selected food fatty acid names, lengths, and double bonds. (Adapted from Nawar, 1996.)
Figure 4.14 Representation of stearic acid, cis-oleic acid, and trans-oleic acid. Trans fatty acids, produced inadvertently during hydrogenation of unsaturated oils, have lower steric interference with respect to packing compared to cis double bonds.
Figure 4.15 The general structure of a triglyceride, where n indicates the number of methylene groups between the carbonyl carbon and the omega carbon of an FA chain.
Figure 4.16 The structures of two common phospholipid types, where n is variable.
Figure 4.17 Deoxyadenosine (A), deoxyguanosine (G), deoxythymidine (T), and deoxycytidine (C) are the four sugar bases of DNA; the four structures that encode for every gene in nature. ‘Deoxy’ refers to the lack of a hydroxyl at C2 of the sugar (deoxyribose) ring.