Download
1 / 1
10 likes | 136 Views
Systems Biology Assessment of Human Immune Responses after Seasonal Trivalent Inactivated Influenza Vaccine Kristen L Hoek 1 , Leigh M Howard 2 , Tara M Allos 1 , Parimal Samir 3 , Kirsten E Diggins 1 , Qi Liu 4 , Nripesh Prasad 5,6 , Megan Shuey 1 , Xinnan Niu 1 ,

E N D
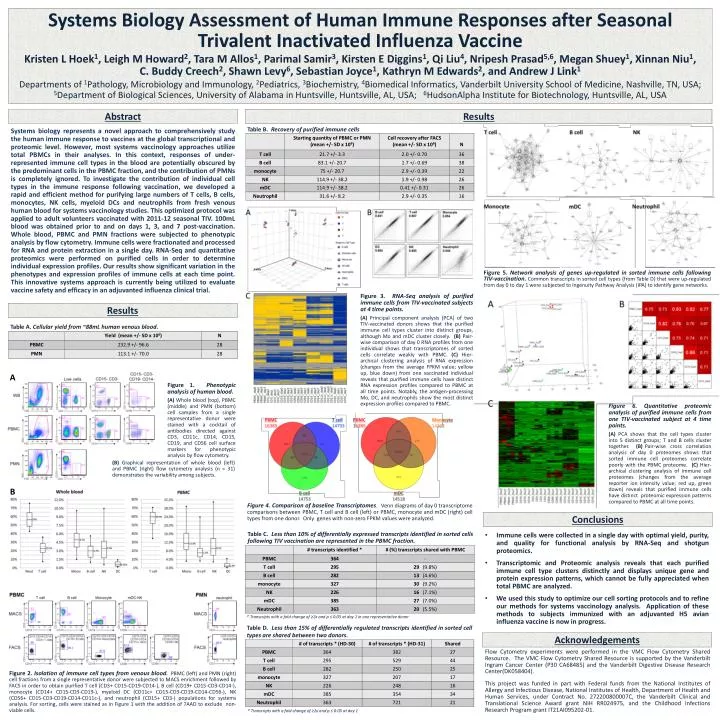
Systems Biology Assessment of Human Immune Responses after Seasonal Trivalent Inactivated Influenza Vaccine Kristen L Hoek1, Leigh M Howard2, Tara M Allos1, Parimal Samir3, Kirsten E Diggins1, Qi Liu4, Nripesh Prasad5,6, Megan Shuey1, XinnanNiu1, C. Buddy Creech2, Shawn Levy6, Sebastian Joyce1, Kathryn M Edwards2, and Andrew J Link1 Departments of 1Pathology, Microbiology and Immunology, 2Pediatrics, 3Biochemistry, 4Biomedical Informatics, Vanderbilt University School of Medicine, Nashville, TN, USA; 5Department of Biological Sciences, University of Alabama in Huntsville, Huntsville, AL, USA; 6HudsonAlpha Institute for Biotechnology, Huntsville, AL, USA Abstract Results Table B. Recovery of purified immune cells Systems biology represents a novel approach to comprehensively study the human immune response to vaccines at the global transcriptional and proteomic level. However, most systems vaccinology approaches utilize total PBMCs in their analyses. In this context, responses of under-represented immune cell types in the blood are potentially obscured by the predominant cells in the PBMC fraction, and the contribution of PMNs is completely ignored. To investigate the contribution of individual cell types in the immune response following vaccination, we developed a rapid and efficient method for purifying large numbers of T cells, B cells, monocytes, NK cells, myeloid DCs and neutrophils from fresh venous human blood for systems vaccinology studies. This optimized protocol was applied to adult volunteers vaccinated with 2011-12 seasonal TIV. 100mL blood was obtained prior to and on days 1, 3, and 7 post-vaccination. Whole blood, PBMC and PMN fractions were subjected to phenotypic analysis by flow cytometry. Immune cells were fractionated and processed for RNA and protein extraction in a single day. RNA-Seq and quantitative proteomics were performed on purified cells in order to determine individual expression profiles. Our results show significant variation in the phenotypes and expression profiles of immune cells at each time point. This innovative systems approach is currently being utilized to evaluate vaccine safety and efficacy in an adjuvanted influenza clinical trial. Figure 5. Network analysis of genes up-regulated in sorted immune cells following TIV-vaccination. Common transcripts in sorted cell types (from Table D) that were up-regulated from day 0 to day 1 were subjected to Ingenuity Pathway Analysis (IPA) to identify gene networks. Figure 3. RNA-Seq analysis of purified immune cells from TIV-vaccinated subjects at 4 time points. (A)Principal component analysis (PCA) of two TIV-vaccinated donors shows that the purified immune cell types cluster into distinct groups, although Mo and mDCcluster closely. (B) Pair-wise comparison of day 0 RNA profiles from one individual shows that transcriptomes of sorted cells correlate weakly with PBMC. (C)Hier-archicalclustering analysis of RNA expression (changes from the average FPKM value; yellow up, blue down) from one vaccinated individual reveals that purified immune cells have distinct RNA expression profiles compared to PBMC at all time points. Notably, the antigen-processing Mo, DC, and neutrophils show the most distinct expression profiles compared to PBMC. Results Table A. Cellular yield from ~88mL human venous blood. A Figure 1. Phenotypic analysis of human blood. (A) Whole blood (top), PBMC (middle) and PMN (bottom) cell samples from a single representative donor were stained with a cocktail of antibodies directed against CD3, CD11c, CD14, CD15, CD19, and CD56 cell surface markers for phenotypic analysis by flow cytometry. Figure 6. Quantitative proteomic analysis of purified immune cells from one TIV-vaccinated subject at 4 time points. (A) PCA shows that the cell types cluster into 5 distinct groups; T and B cells cluster together. (B)Pair-wise cross correlation analysis of day 0 proteomes shows that sorted immune cell proteomes correlate poorly with the PBMC proteome. (C)Hier-archicalclustering analysis of immune cell proteomes (changes from the average reporter ion intensity value; red up, green down) reveals that purified immune cells have distinct proteomic expression patterns compared to PBMC at all time points. (B) Graphical representation of whole blood (left) and PBMC (right) flow cytometry analysis (n = 31) demonstrates the variability among subjects. B Figure 4. Comparison of baseline Transcriptomes. Venn diagrams of day 0 transcriptome comparisons between PBMC, T cell and B cell (left) or PBMC, monocyte and mDC (right) cell types from one donor. Only genes with non-zero FPKM values were analyzed. Conclusions • Immune cells were collected in a single day with optimal yield, purity, and quality for functional analysis by RNA-Seq and shotgun proteomics. • Transcriptomic and Proteomic analysis reveals that each purified immune cell type clusters distinctly and displays unique gene and protein expression patterns, which cannot be fully appreciated when total PBMC are analyzed. • We used this study to optimize our cell sorting protocols and to refine our methods for systems vaccinology analysis. Application of these methods to subjects immunized with an adjuvantedH5 avian influenza vaccine is now in progress. Table C. Less than 10% of differentially expressed transcripts identified in sorted cells following TIV vaccination are represented in the PBMC fraction. * Transcripts with a fold change of ≥2x and p ≤ 0.05 at day 1 in one representative donor Table D. Less than 15% of differentially regulated transcripts identified in sorted cell types are shared between two donors. Acknowledgements Flow Cytometry experiments were performed in the VMC Flow Cytometry Shared Resource. The VMC Flow Cytometry Shared Resource is supported by the Vanderbilt Ingram Cancer Center (P30 CA68485) and the Vanderbilt Digestive Disease Research Center(DK058404). This project was funded in part with Federal funds from the National Institutes of Allergy and Infectious Disease, National Institutes of Health, Department of Health and Human Services, under Contract No. 272200800007C, the Vanderbilt Clinical and Translational Science Award grant NIH RR024975, and the Childhood Infections Research Program grant IT21AI095202-01. Figure 2. Isolation of immune cell types from venous blood. PBMC (left) and PMN (right) cell fractions from a single representative donor were subjected to MACS enrichment followed by FACS in order to obtain purified T cell (CD3+ CD15-CD19-CD14-), B cell (CD19+ CD15-CD3-CD14-), monocyte (CD14+ CD15-CD3-CD19-), myeloid DC (CD11c+ CD15-CD3-CD19-CD14-CD56-), NK (CD56+ CD15-CD3-CD19-CD14-CD11c-), and neutrophil (CD15+ CD3-) populations for systems analysis. For sorting, cells were stained as in Figure 1 with the addition of 7AAD to exclude non-viable cells. * Transcripts with a fold change of ≥2x and p ≤ 0.05 at day 1