Download
1 / 37
380 likes | 491 Views
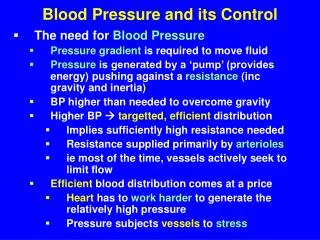
Cardiac Cycle, Blood Pressure and its Measurement. 3.7.2012. Blood Pressure. Blood pressure ( BP ) is the pressure exerted by circulating blood upon the walls of blood vessels

E N D
Blood Pressure • Blood pressure (BP) is the pressure exerted by circulating blood upon the walls of blood vessels • The blood pressure in the circulation is principally due to the pumping action of the heart. Differences in blood pressure are responsible for blood flow from one location to another in the circulation
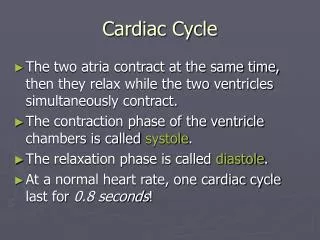
Cardiac Cycle - Filling of Heart Chambers • Heart is two pumps that work together, right and left half • Repetitive contraction (systole) and relaxation (diastole) of heart chambers • Blood moves through circulatory system from areas of higher to lower pressure. • Contraction of heart produces the pressure
Systolic and Diastolic Pressure • The force of contraction of the ventricles raises the pressure to about 120mmHg (systolic pressure) and the elastic recoil of the arteries maintain the pressure to about 80mmHg during ventricular diastole (diastolic pressure) • This pressure is enough to keep the blood flowing continuously to all parts of the body
Mean arterial pressure • It is a term used in medicine to describe an average blood pressure in an individual.It is defined as the average arterial pressure during a single cardiac cycle • Mean arterial blood pressure is not the arithmetic mean of systolic and diastolic pressure but is instead about 93mmHg • This is because the time the heart spends relaxing is longer than the time it spends contracting and ejecting blood into aorta
Blood Pressure Profile • Blood pressure is highest in the arteries. It decreases as the circulating blood moves away from the heart through arterioles, capillaries and then to veins due to viscous losses of energy • Although blood pressure drops over the whole circulation, most of the fall occurs along the arterioles
Reference points for measuring blood pressure • While measuring pressures in cardiovascular system, ambient atmospheric pressure is used as zero reference point. Thus a blood pressure of 90mmHg means that pressure is 90mmHg above atmospheric pressure • The second reference point for measuring blood pressure is anatomical and is the position of heart. For example, the usual convention is to measure blood pressure in the brachial artery above elbow i.e. approximately at hearts level when patient is seated • If the blood pressure measurements are to be made in the legs, the patient is brought to lying down position. In this position vessel is approximately at cardiac level
Blood pressure measurement • Direct method This is an invasive method in which artery or vein is cannulated or catheterised. Pressure measured by direct method is known as “end pressure” Here the kinetic energy of blood flow is measured in terms of pressure. Direct method is used in patients of ‘shock’ where indirect measurements may be inaccurate or indeed impossible
Indirect methods of blood pressure measurement • Indirect method (non-invasive, measures lateral/side pressure) Auscultatory Oscillometric
Auscultatory Method • The auscultatory method uses a stethoscope and a sphygmomanometer • An inflatable cuff encircles the arm. Pressure in the cuff is transmitted through the tissue to compress brachial artery and can be viewed on a manometer • A stethoscope is used to listen to sounds in the artery distal to the cuff. The sounds heard during measurement of blood pressure are not the same as the heart sounds 'lub' and 'dub' that are due to vibrations inside the ventricles that are associated with the snapping shut of the valves
Auscultatory Method • If a stethoscope is placed over the brachial artery in a normal person no sound should be audible. As the heart beats, pulses (pressure waves) are transmitted smoothly via laminar (non-turbulent) blood flow throughout the arteries, and no sound is produced • Similarly, if the cuff of a sphygmomanometer is placed around a patient's upper arm and inflated to a pressure above the patient's systolic blood pressure, there will be no sound audible. This is because the pressure in the cuff is high enough such that it completely occludes the blood flow This is similar to a flexible tube or pipe with fluid in it that is being pinched shut
Korotkoff sounds • If the pressure is dropped to a level equal to that of the patient's systolic blood pressure, the first Korotkoff sound will be heard. • As the pressure in the cuff is the same as the pressure produced by the heart, some blood will be able to pass through the upper arm when the pressure in the artery rises during systole. This blood flows in spurts as the pressure in the artery rises above the pressure in the cuff and then drops back down beyond the cuffed region, resulting in turbulence that produces an audible sound
Korotkoff sounds • As the pressure in the cuff is allowed to fall further, thumping sounds continue to be heard as long as the pressure in the cuff is between the systolic and diastolic pressures, as the arterial pressure keeps on rising above and dropping back below the pressure in the cuff. • Eventually, as the pressure in the cuff drops further, the sounds change in quality, then become muted, and finally disappear altogether. This occurs because, as the pressure in the cuff drops below the diastolic blood pressure, the cuff no longer provides any restriction to blood flow allowing the blood flow to become smooth again with no turbulence and thus produce no further audible sound. The pressure where sound just disappears is the diastolic pressure
Oscillometric method • The oscillometric method was first demonstrated in 1876 and involves the observation of oscillations in the sphygmomanometer cuff pressure[which are caused by the oscillations of blood flow, i.e. the pulse • It uses a sphygmomanometer cuff, like the auscultatory method, but with an electronic pressure sensor (transducer) to observe cuff pressure oscillations, electronics to automatically interpret them, and automatic inflation and deflation of the cuff.
Oscillometric method • The cuff is inflated to a pressure initially in excess of the systolic arterial pressure and then reduced to below diastolic pressure over a period of about 30 seconds. • When blood flow is nil (cuff pressure exceeding systolic pressure) or unimpeded (cuff pressure below diastolic pressure), cuff pressure will be essentially constant. It is essential that the cuff size is correct: undersized cuffs may yield too high a pressure; oversized cuffs yield too low a pressure
Oscillometric method • When blood flow is present, but restricted, the cuff pressure, which is monitored by the pressure sensor, will vary periodically in synchrony with the cyclic expansion and contraction of the brachial artery, i.e., it will oscillate. The values of systolic and diastolic pressure are computed, results are displayed
r P1 P2 L DP= P1 - P2 Hagen–Poiseuille law or Poiseuille law • In fluid dynamics, the Hagen–Poiseuille equation is a physical law that states that for steady laminar flow of a Newtonian fluid through a cylindrical tube, the pressure drop in the tube is directly proportional to the volume flow rate Q, length of the tube, viscosity of fluid and inversely proportional to fourth power of radius of tube Where ∆P is the pressure drop L is the length of pipe, ƞ is the dynamic viscosity, Q is the volumetric flow rate and r is the radius of the pipe
Hagen–Poiseuille law or Poiseuille law • Analogous to Ohms law for electrical circuits (V=IR) Poiseuille law can be written as ∆P = Q R Where R is the resistance to blood flow R= 8 L η / πr4
Volume Flow Rate Q • The volume of blood flow from heart is called the cardiac output and is the stroke volume (the volume of blood ejected in each beat) multiplied by hear rate (number of beats per minute). • This is ~ 60 (ml/beat) x 80 (beats/min) = 4800 ml/min • Volume flow rate of blood is Q = 5L/min
Vascular Resistance • Vascular resistance is a term used to define the resistance to flow that must be overcome to push blood through the circulatory system. • The resistance offered by the peripheral circulation is known as the systemic vascular resistance (SVR) • The systemic vascular resistance may also be referred to as the total peripheral resistance
Resistance R • Resistance is dependent on the vessel’s dimensions and the viscosity of blood according to Poiseuille law • A narrowing of an artery leads to a large increase in the resistance to blood flow because of 1/ r4 term • Vasoconstriction (i.e., decrease in blood vessel diameter) increases SVR, whereas vasodilation (increase in diameter) decreases SVR • Peripheral resistance can be equated to DC resistance in electrical circuits
Arrangement of vessels also determines resistance. • When the vessels are arranged in series, the total resistance to flow through all the vessels is the sum of individual resistances, whereas when they are arranged in parallel the reciprocal of the total resistance is the sum of all the reciprocals of the individual resistance • Less resistance is offered to blood flow when vessels are arranged in parallel rather than in series
R1 R2 R3 R1,Q1 DP1 DP2 DP3 R2,Q2 Pressure drop, Q and R Series Parallel DP= DP1 + DP2 + DP3 =QR1+QR2+QR3 =QR \R=R1+R2+R3 Q=Q1+Q2 =DP/R1+DP/R2 =DP/R \1/R=1/R1+1/R2
Resistances in series add directly while resistances in parallel add in reciprocals • Arteries, arterioles, capillaries, venules and veins are in general arranged in series with respect to each other. However, the vascular supply to the various organs and the vessels e.g. capillaries within an organ are arranged in parallel Right and left sides of the heart which are connected in series. Also seen are the various systemic organs receiving blood through parallel arrangement of vessels
Resistance offered by a network of arterioles • Pressure drop across a vessel is greatest when resistance offered to flow is greatest • Most pressure drop occurs across arterioles although it should occur in capillaries with much smaller diameter • Within a network of arterioles or capillaries each arteriole/capillary is parallel to other. We calculate equivalent resistance for network of arterioles as well as for capillaries to check which offers greater resistance to blood flow
L art= 2 . Lcap • [r cap/rart]4 =0.0256 • Rart=2.5 Rcap • For a network of arterioles: Rart(eq) = Rart/ nart • For a network of capillaries Rcap(eq) = Rcap/ ncap Plugging ncap=30nart andRart=2.5 Rcapwe get Rarteq=75 Rcapeq
Rate of blood flow • Blood leaves heart at ~ 30 cm/s • In capillaries, flow slows to ~ 1mm/s • Surprising - continuity should imply higher flow
Equation of continuity, Bernoulli effect • a1 and a2 are areas of cross section and v1 and v2 are velocities • If cross sectional area is large, velocity is low and pressure is high • If cross sectional area of pipe is small, velocity is high and pressure is low
With cross sectional area of 2.5 cm2 ,linear velocity of blood in aorta is 22.5cm/s • On the other hand, in capillaries with cross sectional area of 2500 cm2, linear velocity of blood is simply 0.05cm/s • Hence aorta has smallest cross sectional area but the mean flow velocity is highest • Each capillary is tiny, but since the overall capillary bed contains many billions of vessel, it has total cross sectional area several hundred times that of the aortaand hence the mean blood flow velocity falls several folds
Vessel cross sectional area vs velocity of blood flow • To understand the effect of cross sectional area on flow velocity, a mechanical model has been suggested • Here a series of 1cm diameter balls are depicted as being pushed down a single tube. The tube branches into narrower tubes. Each tributary tube has a area of cross section much smaller than that of the wider tube • Suppose in wide tube each ball moves at 3cm/min . This means 6 balls leave the wide tube per minute and enter narrower tubes • Obviously then these 6 six balls must leave the narrower tubes per minute. This means each ball is moving at a slower speed of 1cm/min
Reference ebooks: • Biophysics by P.S. Mishra • An introduction to Med. Biophysics by Parveen Parkash • Medical Physiology: Principles for Clinical Medicine By Rodney A. Rhoades, David R. Bell