Download
1 / 31
310 likes | 466 Views
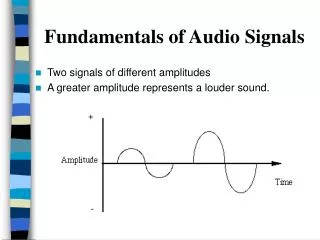
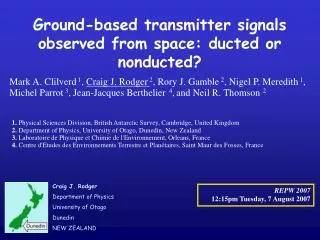
Ground-based transmitter signals observed from space: ducted or nonducted?. Mark A. Clilverd 1 , Craig J. Rodger 2 , Rory J. Gamble 2 , Nigel P. Meredith 1 , Michel Parrot 3 , Jean-Jacques Berthelier 4 , and Neil R. Thomson 2.

E N D
Ground-based transmitter signals observed from space: ducted or nonducted? Mark A. Clilverd 1, Craig J. Rodger2, Rory J. Gamble 2, Nigel P. Meredith 1, Michel Parrot 3, Jean-Jacques Berthelier 4,and Neil R. Thomson 2 1. Physical Sciences Division, British Antarctic Survey, Cambridge, United Kingdom 2. Department of Physics, University of Otago, Dunedin, New Zealand 3. Laboratoire de Physique et Chimie de l'Environnement, Orleans, France 4. Centre d'Etudes des Environnements Terrestre et Planétaires, Saint Maur des Fosses, France Craig J. Rodger Department of Physics University of Otago Dunedin NEW ZEALAND REPW 2007 12:15pm Tuesday, 7 August 2007
Introduction In the nearly five decades since the discovery of the radiation belts we are only now starting to get a handle on the principal source and loss mechanisms that determine the population of radiation belt electrons. Explorer 1 – post launch press conference Van Allen and Frank, Nature, vol. 183, 1959. In the inner-belt and slot region, losses appear to be dominated by whistler mode waves, generated from a variety of sources.
L L Whistler-mode Wave Losses It has been suggested that manmade VLF transmitters drive the dominant losses in the inner radiation belts. Abel and Thorne, J. Geophys. Res., vol. 103, 1998. In addition, we have previously argued that lightning generated whistlers are probably dominant in this zone, at least for some energy ranges. Rodger et al., J. Geophys. Res., 10.1029/2003JA009906, 2003.
Seasonal WEP losses versus other processes WEP is lightning driven, and so is a strongly seasonal process, as well as L and energy dependant (red lines are Tx-dominated from Abel and Thorne). Transmitter lifetimes WEP lifetimes Rodger et al., Geophys. Res. Lett., 10.1029/2004GL019501, 2004. We found that at low energies (~100 keV) WEP dominated at all seasons and for all the L-shells where the whistlers will resonate with these electrons. In contrast, by ~300 keV WEP never dominates at L=2.4, but at L=2 dominates in all seasons, but with varying lifetimes. However, as this community knows well, there are a lot of complex assumptions in any calculation in this area!
Ducted or non-ducted propagation One issue which has raised its head in the last 10 years or so is the nature of the dominant propagation mode for whistler-mode waves which propagate from the ground into the plasmasphere. This will strongly determine how lightning-generated whistlers and VLF Tx signals interact with energetic radiation belt electrons. The possibilities are: ducted propagation dominates non-ducted propagation dominates some combination of the two
Ducted propagation In ducted propagation the dominant VLF signal propagates in a "whistler duct" - a field aligned modification to the (cold) plasmaspheric density. This is the "traditional" model for considering the dominant process by which ground based VLF propagated through the region of the inner radiation belt. Ducted propagation would mean primarily equatorial gyro-resonance, occurring at the L of the whistler duct. Properties:ducting doesn’t happen at the lowest L (L<1.6) real ducts are not "strong" enough ducting not supported for frequencies > half-gyrowaves just fall out of the sides of the duct!
Non-ducted (or oblique) propagation From Peter and Inan [JGR, 2004] In non-ducted propagation the dominant VLF signal is not trapped inside the whistler duct, and spreads through a large portion of the plasmasphere. Non-ducted propagation creates resonance with a broad energy range, including higher energies than ducted allows. Precipitation is displaced polewards of source.
Why does this matter? In order to properly understand how lightning and ground-based VLF transmitters influence the electrons in the inner radiation belt, we need to know how the waves propagate through this region. In particular, the ducted or non-ducted propagation routes determine the resonance energies involved. Non-ducted propagation provides for much higher resonance energies. This would allow lightning and VLF transmitters to have a more important role for energetic electron losses. VLF transmitters, which we can control, would therefore be potentially useful for the manmade control of the RB - Radiation Belt Remediation. Debris from Starfish nuclear test (400km alt burst) 1.4 MT, 9 July 1962. [LANL]
How to test which is dominant? Over the last decade or so, a number of studies have argued that non-ducted propagation is the most important route by which ground based signals are present in the plasmasphere, and hence how those signals interact with energetic RB electrons. In particular, studies from Stanford University have suggested that while ducted propagation exists, the dominant precipitation mechanism will be from the more common non-ducted path, which should fill the plasmasphere. Studies using lightning-driven precipitation have been used as evidence for this. Highly evolved modelling techniques have been developed to describe this propagation path, and how these WM waves will interact with RB electrons. It is challenging to use lightning and ground-based measurements of precipitation to determine whether ducted or non-ducted is dominant, due to the unknowns (where is the duct?). Thus we will move into space, and use large fixed location VLF transmitters.
VLF transmitters Primarily military communications transmitters. Very high output powers and near continuous operation. Neil Thomson in front of the towers of the US Navy VLF transmitter at Lualualei, Hawaii (NPM). Radiated power of 500 kW at 21.4 kHz. Each tower is 460m high. ~2 km GoogleEarth view of the US Navy VLF transmitter NAA (Cutler, Maine). Radiated power of ~1 MW at 24.0 kHz.
These VLF Tx span the range of inner RB L-shells, and also represent a range of output powers, from ~100kW to 1 MW.
TESTING: ducted transmitters (L>1.6) should on average have peak powers in the conjugate hemisphere close to the conjugate point. Non-ducted should be strongly shifted polewards. Also, high L Tx will be affected by the half-gyro cutoff. Non ducted propagation will not be affected by this!
DEMETER • Sun-synchronous polar orbit, altitude of 710 km • Data available for inv. lat. <65o • Observations at 10.5 and 22.5 LT • Launched late June 2004, still operational Wave Data Take VLF wave data from the Instrument Champ Electrique (ICE), which provides continuous measurements of the power spectrum of one electric field component. Spectra up to 20kHz, with a frequency channel resolution of 19.25 Hz. Look only at nighttime (22.5 LT) observations. Taken data from Jan 2005 and August/September 2005.
Example of DEMETER Wave Data Le Blanc – 18.3 RUS – 17.9 Moskva – 17.021 Ramsloh – 16.6 Krasnodar – 15.625 Krasnodar – 14.881 Krasnodar – 13.281 Krasnodar – 12.649 Krasnodar – 11.905 This transmitter actually operates at 23.4kHz, but is aliased through to 16.6kHz due to the 20kHz Nyquist frequency. This increases the range of Tx we can examine with DEMETER!
Nightside- example of processed data Use DEMETER data to map out the received signal strength of in the ionosphere above the transmitter location, and in the conjugate region in the opposite hemisphere.Observations projected to 100km using the IGRF (2000) magnetic field model, plotted with a resolution of 2º × 2º.
CRRESCombined Release and Radiation Effects Satellite (CRRES) • Low inclination • GTO orbit(perigee 305 km, apogee 35,768 km) • Period of 10 hours • 1.05 < L < 8 • -30o < λm< +30o (i.e. around the geomagnetic equator) • Launched 25 July 1990, failed 12 October 1991 Wave Data Take VLF wave data from the CRRES sweep frequency receiver Band 3 (6.4 to 51.7 kHz examined by 32 steps inside each band). Typical bandwidth of 900 Hz (c.f. VLF transmissions ~200 Hz). Look only at nighttime observations.
plasmapause plasmapause fuhr fce chorus waves flhr Example of CRRES Wave Data VLF transmitters
Nightside all data Mapped to ionosphere using IGRF-1985 with a 5º × 5º resolution
Mapped to ionosphere using IGRF-1985 with a 5º × 5º resolution Dayside all data
DEMETER CRRES VLF Tx We follow the wave power from each of the transmitters studied, first in the ionosphere above it, then on the field line near the geomagnetic equator, and then finally in the ionosphere in the conjugate region. Thus we investigate the comparative influences of ducted and non-ducted wave propagation through the plasmasphere.
NPM - L=1.17 Predicted NPM equatorial power from Inan et al. [2007] DEMETER NPM was operating just outside CRRES' freq. range, so only DEMETER data. Not wonderfully clear due to us having to use Nyquist to see signal at 18.6kHz (21.4kHz). Peak power is located ~7º poleward of conjugate. Neil Thomson has studied ducted waves from NPM for ~20 years. They occur for only a few hours every 3 days, and range over 1.6<L<2.5. Non-ducted propagation dominates here, but not as “bent” as expected.
L=1.44 DEMETER CRRES Essentially the same pattern for NWC in DEMETER and CRRES data. In the SH the peak power is above the Tx. In the conjugate hemisphere it is shifted polewards by ~10º. Consistent with ducting starting at L≈1.6, and a mix of non-ducted and ducted propagation. Hard to separate out effects.
L=1.83 DEMETER CRRES Essentially the same pattern for NWC in DEMETER and CRRES data. In the SH the peak power is above the Tx. In the conjugate hemisphere peak power is shifted polewards by 5-10º. Could be ducting starting at L≈1.5-1.6, & a mix of non-ducted & ducted propagation. Hard to separate out effects.
Peak power in the conjugate hemisphere is at the Tx conjugate. No poleward shift atall! Looks ducted! NTS - L=2.33 No CRRES data as this Tx started quite recently! DEMETER
NSS - L=2.43 CRRES only NSS shut down on 18 January 1996, and was permanently decommissioned shortly afterwards. Thus no DEMETER observations are possible! Looking only at the CRRES data, we find that the peak power region is shifted 4º equatorwards of the conjugate region. No power seen above the half-gyro frequency. Strongly suggests ducting is the dominant mechanism.
Half-gyro L=2.63 L=2.93 CRRES DEMETER For NAA, the satellite pictures are different. For DEMETER in the NH the peak power is over the Tx, but not for CRRES! The conjugate point in the SH is past the half-gyro frequency line, and there is very little wave power above this cutoff line. Very strongly suggests ducting is dominant.
How small is the non-ducted component for NAA? We have used techniques to suppress lightning noise, which is very strong in the North American sector. The difference between the point above the Tx (×) and its conjugate location () is 170 times. The conjugate peak wave power is ~20 times larger than seen at the conjugate point (which is above the half-gyro cutoff). DEMETER The fact that the half gyrofrequency cutoff plays such a strong role is indicative of ducted propagation. At best, one might argue that the non-ducted fraction was ~5% of the ducted, although the pattern is suggestive of much less non-ducted propagation.
Implications for VLF Tx gyroresonance For the transmitters whose propagation paths are dominated by ducted propagation, we can determine the likely electron precipitation energies (in keV) expected from each transmitter assuming parallel (0º wave normal angle) cyclotron resonance interactions at the field line geomagnetic equator.
Conclusions By combining observations made just above the ionosphere by DEMETER and those at the geomagnetic equator by CRRES, we have provided the first experimental examination of the relative importance of ducted and non-ducted precipitation. • At low L (i.e., L<1.6) a significant proportion of wave-power is non-ducted. • Beyond L>1.6 waves become increasingly ducted. By L≈2-3, there is very little evidence of non-ducted waves. • This will have implications for studies which assume the dominance of non-ducted propagation. • NWC is particularly well placed to produce scattering of inner RB energetic electrons, as it has both requirements of high power and low L. Watch this space.
Rodger and Clilverd, Perugia (Italy) during the IUGG conference in 2007 Thankyou! Are there any questions?