Download
1 / 1
10 likes | 94 Views
Introduction. Results and Discussion. Table 1 . Descriptive statistics for explanatory variables used for identifying important factors affecting N availability in 1525 field-years in 2007-2008 in Lancaster County, Pennsylvania.

E N D
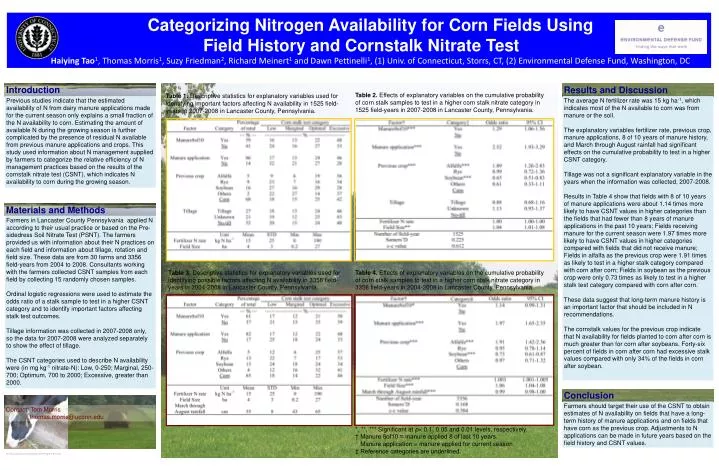
Introduction Results and Discussion Table 1. Descriptive statistics for explanatory variables used for identifying important factors affecting N availability in 1525 field-years in 2007-2008 in Lancaster County, Pennsylvania. Table 2. Effects of explanatory variables on the cumulative probability of corn stalk samples to test in a higher corn stalk nitrate category in 1525 field-years in 2007-2008 in Lancaster County, Pennsylvania. Previous studies indicate that the estimated availability of N from dairy manure applications made for the current season only explains a small fraction of the N availability to corn. Estimating the amount of available N during the growing season is further complicated by the presence of residual N available from previous manure applications and crops. This study used information about N management supplied by farmers to categorize the relative efficiency of N management practices based on the results of the cornstalk nitrate test (CSNT), which indicates N availability to corn during the growing season. The average N fertilizer rate was 15 kg ha-1, which indicates most of the N available to corn was from manure or the soil. The explanatory variables fertilizer rate, previous crop, manure applications, 8 of 10 years of manure history, and March through August rainfall had significant effects on the cumulative probability to test in a higher CSNT category. Tillage was not a significant explanatory variable in the years when the information was collected, 2007-2008. Results in Table 4 show that fields with 8 of 10 years of manure applications were about 1.14 times more likely to have CSNT values in higher categories than the fields that had fewer than 8 years of manure applications in the past 10 years; Fields receiving manure for the current season were 1.97 times more likely to have CSNT values in higher categories compared with fields that did not receive manure; Fields in alfalfa as the previous crop were 1.91 times as likely to test in a higher stalk category compared with corn after corn; Fields in soybean as the previous crop were only 0.73 times as likely to test in a higher stalk test category compared with corn after corn. These data suggest that long-term manure history is an important factor that should be included in N recommendations. The cornstalk values for the previous crop indicate that N availability for fields planted to corn after corn is much greater than for corn after soybeans. Forty-six percent of fields in corn after corn had excessive stalk values compared with only 34% of the fields in corn after soybean. Categorizing Nitrogen Availability for Corn Fields Using Field History and Cornstalk Nitrate TestHaiying Tao1, Thomas Morris1, Suzy Friedman2, Richard Meinert1 and Dawn Pettinelli1, (1) Univ. of Connecticut, Storrs, CT, (2) Environmental Defense Fund, Washington, DC Materials and Methods Farmers in Lancaster County Pennsylvania applied N according to their usual practice or based on the Pre-sidedress Soil Nitrate Test (PSNT). The farmers provided us with information about their N practices on each field and information about tillage, rotation and field size. These data are from 30 farms and 3356 field-years from 2004 to 2008. Consultants working with the farmers collected CSNT samples from each field by collecting 15 randomly chosen samples. Ordinal logistic regressions were used to estimate the odds ratio of a stalk sample to test in a higher CSNT category and to identify important factors affecting stalk test outcomes. Tillage information was collected in 2007-2008 only, so the data for 2007-2008 were analyzed separately to show the effect of tillage. The CSNT categories used to describe N availability were (in mg kg-1 nitrate-N): Low, 0-250; Marginal, 250-700; Optimum, 700 to 2000; Excessive, greater than 2000. Table 3. Descriptive statistics for explanatory variables used for identifying possible factors affecting N availability in 3356 field-years in 2004-2008 in Lancaster County, Pennsylvania. Table 4. Effects of explanatory variables on the cumulative probability of corn stalk samples to test in a higher corn stalk nitrate category in 3356 field-years in 2004-2008 in Lancaster County, Pennsylvania. Conclusion Farmers should target their use of the CSNT to obtain estimates of N availability on fields that have a long-term history of manure applications and on fields that have corn as the previous crop. Adjustments to N applications can be made in future years based on the field history and CSNT values. Contact: Tom Morris thomas.morris@uconn.edu *, **, *** Significant at p< 0.1, 0.05 and 0.01 levels, respectively. † Manure 8of10 = manure applied 8 of last 10 years. Manure application = manure applied for current season. ‡ Reference categories are underlined. An Equal Opportunity Employer and Program Provider