Download
1 / 9
90 likes | 96 Views
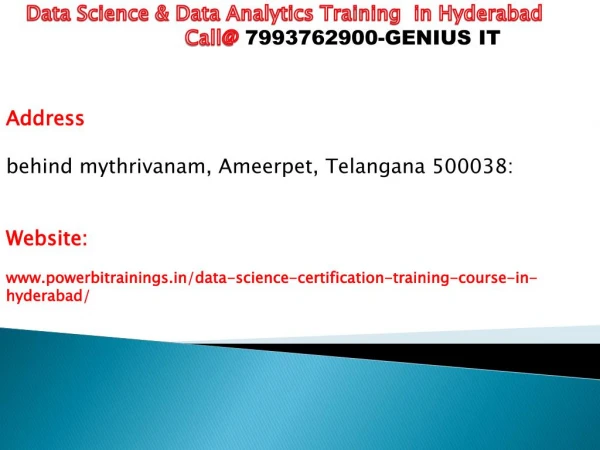
Sterling IT is one of the best institutes for Data science training in Hyderabad.

E N D
Data science? • Introduction to R • Data analysis? • Data visualization? • Predictive Analysis • Deep learning?
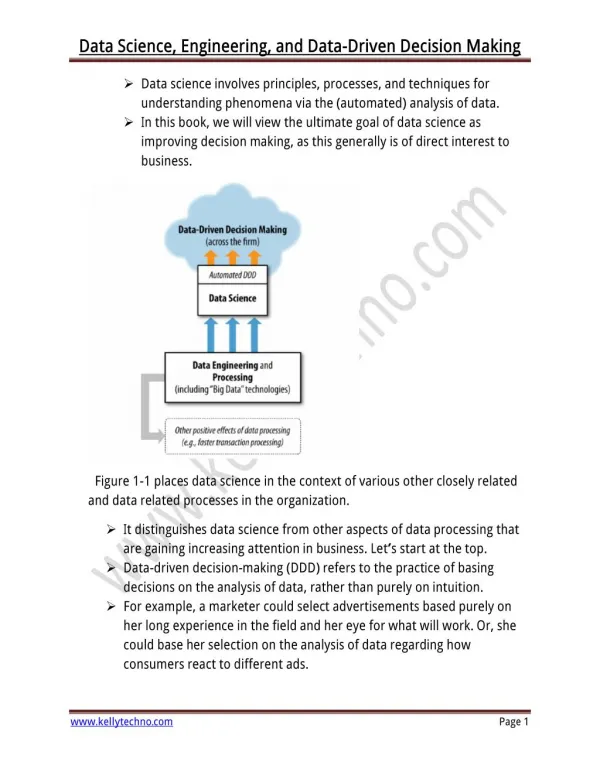
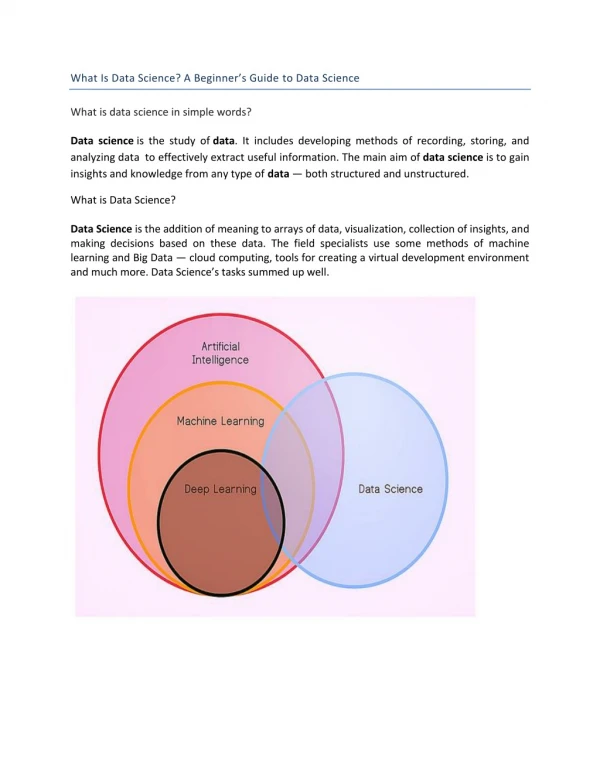
What is Data science? • Data science is a broad field that refers to the collective processes, theories, concepts, tools and technologies that enable the review, analysis and extraction of valuable knowledge and information from raw data. It is geared toward helping individuals and organizations make better decisions from stored, consumed and managed data
Introduction to R • R is a programming language and software environment for statistical computing and graphics that is supported by the R Foundation for Statistical Computing. The R language is widely used among statisticians and data miners for developing statistical software and data analysis. • R language is an open source program maintained by the R core-development team. It is a team of volunteer developers from across the globe. • R language used for performing statistical operations • It is available from the R-Project website www.r-project.org. • R is a command line driven program. • The user enters commands at the prompt (> by default) and each command is executed one at a time.
What is Data Analysis? • Data analysis is a process of inspecting, cleansing, transforming, and modeling data with the goal of discovering useful information, informing conclusions, and supporting decision-making. • This is the step where the cleaned and aggregated data is imported into analysis tools. These tools allow you to explore the data, find patterns in it, and ask and answer what-if questions. This is the process by which sense is made of data gathered in research by proper application of statistical methods
What is Data visualization? • Data visualization is a general term that describes any effort to help people understand the significance of data by placing it in a visual context. Patterns, trends and correlations that might go undetected in text-based data can be exposed and recognized easier with data visualization software
What is predictive Analysis? • Predictive analytics is a form of advanced analytics that uses both new and historical data to forecast activity, behavior and trends. It involves applying statistical analysis techniques, analytical queries and automated machine learning algorithms to data sets to create predictive modelsthat place a numerical value -- or score -- on the likelihood of a particular event happening.
What is Deep learning? • Deep learning is a collection of algorithms used in machine learning, used to model high-level abstractions in data through the use of model architectures, which are composed of multiple nonlinear transformations. It is part of a broad family of methods used for machine learning that are based on learning representations of data. • Deep learning is a specific approach used for building and training neural networks, which are considered highly promising decision-making nodes. An algorithm is considered to be deep if the input data is passed through a series of nonlinearities or nonlinear transformations before it becomes output..